Quantcast
Channel: IndiaSpend
Viewing all 2291 articles
Browse latest View live

Star Power: Maharashtra Starts Rating Industries By Emissions

$
0
0

factory_620


The Maharashtra Pollution Control Board (MPCB) launched a new Star Rating Programme for air pollution on June 5, 2017–World Environment Day. The programme uses smoke-stack emissions data that MPCB is already collecting. But, since sampling results are not very comprehensible to the general public, MPCB is turning these pollution readings into an easy-to-understand Star Rating.


Under the new scheme, industries are rated based on the density of fine particulate pollution coming from their smoke stacks. The best performing industries receive five stars. Those with the highest density of emissions receive only one star. Industry, government and the public can then log onto the MPCB website to access the report cards for plants in their area.


India is making headway to ambitious goals for clean energy, such as solar and wind power. Between 2017 and 2040, India will account for 15% of the estimated $10.2 trillion global investment in power generation. As these technologies get better and cheaper, the costs of going green have fallen. Earlier this year, the cost of solar power (Rs 2.62/kWh) fell below the market price for coal-generated power by the National Thermal Power Corporation, India’s largest power utility (Rs. 3.2/kWh), as The Guardian reported on May 10, 2017. The cost of solar energy could drop a further 66% by 2040 over current costs, according to the Bloomberg New Energy Outlook 2017 report. Yet, progress in technology alone will not be enough for industry to take up cleaner growth.


Maharashtra knows the benefits and the by-products of growth. For instance, the heavy industry centre of Chandrapur is ranked the most polluted city in India as of 2016 with an air-quality index (AQI) of 824. The MPCB regulates industries in Maharashtra and requires advanced control technology. What more can be done to bring this pollution down? In an area as thick with cement, power, and other heavy industries as Chandrapur, it is hard for the public to know the answer to this question.


The Maharashtra Star Rating Programme is the first government-led initiative in India that makes data available from approximately 20,000 industrial stack samples over multiple years. An easy and accessible way to inform residents of Maharashtra about the industry emissions around where they live and work, the programme has the added benefit of infusing transparency and accountability into the system.


Such transparency can bring about change in two possible ways. First, by making citizens more informed about the sources of pollution in their communities, citizens can then call for action. And second, by giving industries information on their pollution emissions, they may discover inefficiencies in their system and opportunities for improvements such as installing new technologies.


It could also instil some healthy competition. There’s a growing literature in behavioural economics (here, here and here) that suggests that knowing what your peers are doing can be an important source of change. So, industries may see how their performance compares to others and be motivated to improve. Along the way, they could also learn from each other’s success.


Since the MPCB already collects high-quality data on industrial air pollution emissions on a regular basis, the programme has practically no cost with possibly limitless returns. This innovative policy effort builds on successful technology efforts MPCB has created and championed, such as the mandating of Continuous Emissions Monitoring Systems (CEMS) for high pollution potential industries. In providing access to real-time pollution data, CEMS—like the Star Rating Programme—encourages self-regulation by improving data transparency and quality of information.


The Star Rating scheme is a new kind of regulation in India. It sets ambitious targets for industries, aside from only heaping on penalties. It also informs the broader public to encourage calls for action.


Similar programmes have launched before, such as the Program for Pollution Control Evaluation and Rating (PROPER) in Indonesia, the United States Toxic Release Inventory (TRI), India Centre for Science and Environment Green Rating Programme and AKOBEN in Ghana for rating the environmental performance of industries in the mining sector. However, the Maharashtra Star Rating Programme will be the first ever programme released by a government regulator to provide industry ratings across sectors on particulate matter emissions.


A coalition of researchers from J-PAL South Asia, the Energy Policy Institute at the University of Chicago (EPIC), and Evidence for Policy Design (EPoD) at Harvard Kennedy School will assist the state government in evaluating this programme and tracking its success, which ultimately relies on how industries respond to this information being made public. The effort has the potential to become a global model for how star-rating schemes can function successfully.


(Greenstone is the Milton Friedman Professor in Economics, the College, and the Harris School, as well as the Director of the Energy Policy Institute at University of Chicago (EPIC)Pande is the Mohammed Kamal Professor of Public Policy and co-director of Evidence for Policy Design (EPoD) at Harvard Kennedy School. Ryan is Assistant Professor of Economics at Yale University, and Sudarshan is India Director for EPIC.)


We welcome feedback. Please write to respond@indiaspend.org. We reserve the right to edit responses for language and grammar.

 
__________________________________________________________________


“Liked this story? Indiaspend.org is a non-profit, and we depend on readers like you to drive our public-interest journalism efforts. Donate Rs 500; Rs 1,000, Rs 2,000.”


70% Of India’s Farm Families Spend More Than They Earn–Debt Main Cause of Suicides

$
0
0

farmdebt_620

Farmers stage a demonstration in New Delhi in June 2017. Apart from meagre farm income, rising healthcare costs increase farmer debt–now the primary reason in more than 50% farmer suicides in India.


Nearly 70% of India’s 90 million agricultural households spend more than they earn on average each month, pushing them towards debt, which is now the primary reason in more than half of all suicides by farmers nationwide, according to an IndiaSpend analysis of various government data.


The failing economics of such farms–agricultural households in the south are most indebted–are exacerbated by additional loans that families take to meet health issues, leaving them with diminished ability to invest in farming. Outstanding loans for health reasons doubled over a decade to 2012, and loans for farm business fell by about half over the same period.


These data help understand the nature of India’s farm crisis in the light of the recent spate of farmer protests across states to demand loan waivers and better prices for their crops.


These 62.6 million households spending more than they earn had land holdings of one hectare or less, according to the 2013 situation assessment survey of farm households by the National Sample Survey Office (NSSO), the latest available data.  In contrast, 0.35 million (0.39%) households owning more than 10 hectares of land had an average monthly income of Rs 41,338 and consumption expenditure of Rs 14,447, thereby maintaining a monthly surplus of Rs 26,941.


Nearly 85% of all operational farm holdings in the country are smaller than two hectares in size, NSSO data show.


No more than a third of Indian small and marginal farmers have access to institutional credit, as IndiaSpend reported on June 8, 2017, which suggests that loan waivers may not help them.


Source: Ministry of Statistics and Programme ImplementationNote: ‘Income’ includes earnings from all sources, including non-farm business and wage labour


Households in southern India are most indebted


Andhra Pradesh has the highest share of indebted agricultural households (93%), followed by Telangana (89%) and Tamil Nadu (82.1%). The nationwide figure is 52%.


Source: Ministry of Statistics and Programme Implementation


Indebtedness was listed as the primary reason for 55% of farmer suicides in 2015 and more than 300,000 Indian farmers have committed suicide since 1995, IndiaSpend reported on January 2, 2017.


Rising healthcare costs swell the debt burden


Apart from meagre farm income, rising healthcare costs increase farmer debt. Outstanding loans for health reasons have doubled from 3% in 2002 to 6% in 2012, according to a 2015 analysis of NSSO data by the National Bank For Agriculture and Rural Development (NABARD). Meanwhile, loans for farm business fell by half over a decade, from 58% in 2002 to 29% in 2012, as IndiaSpend reported on July 21, 2015.


Source: National Bank For Agriculture and Rural Development 2015


Nearly half (48%) of overnight trips made by millions of Indians in rural areas are for medical purposes. The corresponding figure for urban areas is 25%.


More than half of India’s rural population uses private healthcare services, which are four times as costly as public healthcare, and can cost the poorest 20% of Indians more than 15 times their average monthly expenditure, as IndiaSpend reported on July 16, 2016.


“In all the farm households I’ve visited, where people have killed themselves, the single largest component of family debt was health costs,” said P Sainath, Ramon Magsaysay Award winner who pioneered farmer suicide reporting in India.


Loan waivers are not a solution


Recently, Uttar Pradesh and Maharashtra wrote off loans worth Rs 36,359 crore and Rs 30,000 crore, respectively. India faces a cumulative loan waiver of Rs 3.1 lakh crore ($49.1 billion), or 2.6% of the country’s gross domestic product in 2016-17, IndiaSpend reported on June 15, 2017.


However, indebtedness is a symptom and not the root cause of India’s farm crisis, according to a 2007 expert group report on agricultural indebtedness. Chaired by economist R Radhakrishna, the group reported that the average farm household borrowing had not been “excessive”, and laid the blame on factors such as “stagnation in agriculture, increasing production and marketing risks, institutional vacuum and lack of alternative livelihood opportunities”.


In his 2016 budget speech, Finance Minister Arun Jaitley had promised to double farmers’ income by 2022. “We are grateful to our farmers for being the backbone of the country’s food security. We need to think beyond food security and give back to our farmers a sense of income security. Government will, therefore, reorient its interventions in the farm and non-farm sectors to double the income of the farmers by 2022,” he had said.


Subsequently, Union Minister for Human Resource Development Prakash Javadekar outlined a seven-point strategy to double farm income, which included measures to step up irrigation, provide better quality seeds and prevent post-harvest losses, as Mint reported on June 17, 2017.


These efforts face a range of challenges, as IndiaSpend said in this March 30, 2016, story. These include: Increasing costs of farm input such as seeds, fertilisers and irrigation; irrelevance of minimum support price for government procurement; absence of marketing infrastructure such as warehouses and cold storages; and the fact that 85% of farmers do not have insurance.


Clearly, India’s farm crisis calls for a multi-pronged solution that addresses each of these challenges, and loan waiver is only one part.


(Saha is an MA Gender and Development student at Institute of Development Studies, University of Sussex.)


We welcome feedback. Please write to respond@indiaspend.org. We reserve the right to edit responses for language and grammar.

__________________________________________________________________


“Liked this story? Indiaspend.org is a non-profit, and we depend on readers like you to drive our public-interest journalism efforts. Donate Rs 500; Rs 1,000, Rs 2,000.”


‘If India Was Serious About TB, We Would Not Have Such A Staggering Disease Burden’

$
0
0

madhupai_514


“India has under-invested in tuberculosis (TB) control for several decades,” Madhukar Pai, Canada research chair in epidemiology & global health at McGill University in Montreal, and the Associate Director of the McGill International TB Centre, told IndiaSpend in an email interview.


“Historically, India has promised a lot in health, but not delivered because of poor investment and weak implementation. So, my wish is for India to spend more on health, and take TB control more seriously,” said Pai, 46, who who did his medical training and community medicine residency in Vellore, India, before a PhD in epidemiology at UC Berkeley. He serves on several TB committees at the World Health Organization (WHO) and of the TB Alliance in New York, and has previously served on the Coordinating Board of the Stop TB Partnership. Pai’s research mainly focuses on improving diagnosis and treatment of tuberculosis, especially in high-burden countries such as India and South Africa.


At 2.8 million, India had 27% of the world’s new TB cases in 2015, with 480,000 deaths in 2014, according to WHO data.


TB, an infectious airborne disease, is treatable but the WHO estimates treatment does not reach 41% of India’s estimated patients, as IndiaSpend reported in October 2016.


About 2.5% of new TB cases are resistant to rifampicin, or to both rifampicin and isoniazid–the two most commonly used anti-TB drugs–while 60% of all previously treated TB cases were drug-resistant. Drug-resistant TB is more difficult and expensive to cure than regular TB.


Still, India’s gains in TB treatment are by no means negligible–from 1997 to 2016, India’s TB control programme saved 7.75 million lives, directly and indirectly through reduced transmission of TB, according to a February 2017 study.


Pai on why India still has the world’s largest TB burden, the country’s successes in TB control, and how it could eliminate the TB epidemic:


Why do you think TB has continued to be a major problem in India?


There are several factors that contribute to India’s enormous TB problem: Inadequate efforts to tackle key social determinants such as poverty, malnutrition and smoking that fuel the epidemic; under-investment in health in general, and in TB, in particular; implementation failures and a weak public health system with big gaps in the cascade of TB care (refers to all steps from the patient coming to a healthcare provider to completing treatment and becoming TB free); and a massive, largely unregulated private sector which offers suboptimal and highly variable quality of TB care, and is poorly engaged in TB control.


Is India doing enough to tackle the TB menace?


Not enough, in my opinion. India has under-invested in TB control for several decades, and that is why the country today accounts for nearly 27% of the world’s 10.4 million new TB cases, and 29% of the 1.8 million TB deaths globally. TB continues to rank among the top five causes of death at ages 30-69, with devastating social and economic consequences. If India had taken serious steps to tackle the TB problem, we would not have such a staggering disease burden.


Source: World Health Organization


What are the major steps India’s Revised National Tuberculosis Control Programme (RNTCP) has taken which will help reduce India’s TB burden?


Recently, the RNTCP published a draft of a new National Strategic Plan (NSP) for TB Elimination 2017-2025. The NSP, if approved, funded, and fully implemented represents a game change in the fight against TB in the country. In addition to strengthening RNTCP to improve services and outcomes for the 1.5 million patients in the public system, the NSP sets out a bold roadmap to reach out to private providers and provide support to the millions of patients treated in the private sector. The annual number of TB cases notified by private providers needs to increase tenfold by 2020, from 0.2 to 2 million. Building on promising pilot results in Mumbai, Patna and Mehsana, the NSP proposes to do so by providing incentives and/or enablers to providers; access to free drugs and diagnostic tests to patients; patient-centric adherence support to TB patients for retention in care.


The cost of implementing the new NSP is estimated at $2.5 billion over the first three years, a substantial increase over the current budget. Historically, despite being a highly cost-effective programme, and despite having a high absorptive capacity, RNTCP has struggled to receive funding that is commensurate with the scale of the epidemic. This simply cannot continue. India must start backing its ambitions with rupees. Therefore, the real test of whether the bold plan by the Health Ministry can be implemented and the ambitious target set by the Finance Ministry achieved will be whether enough resources can be mobilised to find, treat and offer quality care to all TB patients, regardless of where they seek care.


Do you think India will be able to eliminate the TB epidemic by 2025?


The NSP target is 2025, but I think it is an unrealistic goal. I think 2035 is more realistic, provided the NSP is fully funded and fully implemented. If that does not happen, then even the 2035 goal will be tough to meet. While I am excited to see the high-level political commitment and an ambitious NSP, my biggest concern is how India can go from rhetoric to real progress. Historically, India has promised a lot in health, but not delivered because of poor investment and weak implementation. So, my wish is for India to spend more on health, and take TB control more seriously.


What are the main challenges in diagnosing TB in India?


Most patients initially seek care in the private and/or informal sector. Studies show complicated, long care-seeking pathways, with TB diagnostic delays of up to two months, on average, with three care providers seen before diagnosis. When patients with TB seek care, care providers prefer to just treat with broad-spectrum antibiotics, rather than test for TB. This delays diagnosis considerably, and patients often bounce between providers. Thus, poor quality of care in the private and informal sectors is a big issue. About half a million TB patients do reach public health facilities but they are either not successfully diagnosed, or not started on treatment.


In the public sector, the RNTCP relies heavily on antiquated approaches, specially sputum smear microscopy (which can miss half of all TB cases, and cannot detect drug-resistance). Furthermore, while rapid molecular diagnostics such as Xpert MTB/RIF (GeneXpert) and line probe assays are available in the public system, access to patients is quite limited. Most TB patients do not get drug-susceptibility testing (DST). This means, we are often treating TB without knowing whether the drugs will work or not. By the time DST is done, patients may already have failed therapy and developed MDR (multidrug resistant) or XDR-TB (extremely drug-resistant TB).


What Are The Different Kinds Of Tuberculosis?

Kind of TB Description Treatment
Drug-sensitive or regular TB Caused by bacteria (Mycobacterium tuberculosis) that most often affect the lungs Curable, six-month course of four antimicrobial drugs (first-line drugs)
Multi-drug resistant TB (MDR-TB) Caused by Mycobacterium tuberculosis that do not respond to isoniazid and rifampicin, the two most powerful, first-line anti-TB drugs Treatable and curable by using second-line drugs. However, second-line treatment options are limited and require extensive chemotherapy (up to two years of treatment) with medicines that are expensive and toxic.
Extremely drug-resistant TB (XDR-TB) Resistant to at least four of the core anti-TB drugs–two most powerful anti-TB drugs, isoniazid and rifampicin, in addition to resistance to any of the fluoroquinolones (such as levofloxacin or moxifloxacin) and to at least one of the three injectable second-line drugs (amikacin, capreomycin or kanamycin) Can be cured, but with the current drugs available, the likelihood of success is much smaller than in patients with ordinary TB or even MDR-TB. Cure depends on the extent of the drug resistance, the severity of the disease and whether the patientŐs immune system is compromised.

Source: World Health Organization


What should be done about these diagnostic challenges?


RNTCP cannot eliminate TB with century-old sputum smears. There is a desperate need for India to adopt modern, rapid, molecular tools. Countries like South Africa have done this.


The End TB Strategy, set out by the WHO, requires countries to routinely test all TB patients for drug-resistance. To reach this goal, we need better diagnostics to rapidly detect drug resistance, and available drug susceptibility tools such as Xpert MTB/RIF, line probe assays and liquid cultures must be scaled-up to reach more patients, in both public and private sectors.


How are poverty and malnutrition linked to TB?


WHO data for India suggest that low body mass index (BMI), indoor air pollution, and smoking are major risk factors for TB. These risk factors are concentrated in the poor. Members of the poorest quintile in India are at about six-fold higher risk for self-reported prevalent TB than those in the wealthiest quintile, and those in the poorest strata frequently share multiple risk factors for TB, notably malnutrition and indoor air pollution. So, India must seriously address these social factors that fuel the epidemic. RNTCP alone cannot tackle this–it will require inter-sectoral collaboration between multiple ministries, agencies, and civil society. There is also significant opportunity for inclusion of TB in social protection programmes, which can focus on prevention as well as protect patients from impoverishment.


What are India’s strengths and how can we leverage those in the fight against TB?


Despite the overall low investment in health, India has made impressive progress in some areas. India has been polio-free for over five years, and this success has provided huge momentum to global efforts to eradicate polio. Indian drug manufacturers are leaders in the production of generic vaccines, as well as TB and HIV drugs, accounting for more than 80% of the global market. The recent launch of a rotavirus vaccine produced in India has underscored the country’s potential for a leadership role in childhood vaccination. Indian companies are now developing innovative diagnostics, and India has a long tradition of good research in TB.


So, I would love to see these strengths leveraged for TB elimination. I would like to see Indian molecular technologies validated for scale-up. India has great strengths in IT (information technology), and it will be nice to see ICT solutions scaled-up for increasing TB case notifications and for tracking patients. I am happy to see the launch of the India TB Research Consortium (ITRC), to coordinate, fund, and spearhead quality TB research in the country.


(Shah is a reporter/editor with IndiaSpend.)


We welcome feedback. Please write to respond@indiaspend.org. We reserve the right to edit responses for language and grammar.

__________________________________________________________________


“Liked this story? Indiaspend.org is a non-profit, and we depend on readers like you to drive our public-interest journalism efforts. Donate Rs 500; Rs 1,000, Rs 2,000.”


86% Dead In Cow-Related Violence Since 2010 Are Muslim; 97% Attacks After 2014

$
0
0


Muslims were the target of 51% of violence centred on bovine issues over nearly eight years (2010 to 2017) and comprised 86% of 28 Indians killed in 63 incidents, according to an IndiaSpend content analysis of the English media.


As many of 97% of these attacks were reported after Prime Minister Narendra Modi’s government came to power in May 2014, and about half the cow-related violence–32 of 63 cases–were from states governed by the Bharatiya Janata Party (BJP) when the attacks were reported, revealed our analysis of violence recorded until June 25, 2017.


Of the 28 Indians who died over the seven-year period, 24 were Muslim, or 86%. As many as 124 people were also injured in these attacks. More than half (52%) of these attacks were based on rumours, our analysis found.


National or state crime data do not distinguish general violence from cow-related attacks and lynchings, so the IndiaSpend database is the first such statistical perspective to a growing national debate over such violence.


2017 on track to be worst-ever year for cow-related violence


In the first six months of 2017, 20 cow-terror attacks were reported–more than 75% of the 2016 figure, which was the worst year for such violence since 2010.


The attacks include mob lynching, attacks by vigilantes, murder and attempt to murder, harassment, assault and gang-rape. In two attacks, the victims/survivors were chained, stripped and beaten, while in two others, the victims were hanged.


These attacks–sometimes collectively referred to as gautankwad, a portmanteau of the Hindi words for cow and terrorism, on social media–were reported from 19 of 29 Indian states, with Uttar Pradesh (10), Haryana (9), Gujarat (6), Karnataka (6), Madhya Pradesh (4), Delhi (4) and Rajasthan (4) reporting the highest number of cases.


No more than 21% (13 of 63) of the cases were reported from southern or eastern states (including Bengal and Odisha), but almost half (six of 13) were from Karnataka. The only incident reported in the northeast was the murder of two men in Assam on 30 April, 2017.


Note: Data as of June 25, 2017. Compiled by IndiaSpend from media reportage. Incomplete information was cross-checked with local police or reporters. Click here for the list. (Rupnagar in Punjab reported two incidents, one on March 28, 2016 and another on July 31, 2016. The map indicates only first incident, the list mentions details of second incident.)


About half the cases of cow-related violence–32 of 63–were from states governed by the BJP at the time; 8 were run by the Congress, and the rest by other parties, including the Samajwadi Party (Uttar Pradesh), People’s Democratic Party (Jammu & Kashmir) and Aam Aadmi Party (Delhi).


How we built the database


To compile the list of attacks centred on cow-related issues over the past eight years, we ran Google searches with keywords that included, ‘cow vigilantes’, ‘gau-rakshaks’, ‘beef’, ‘lynching’, ‘cow slaughter’, ‘cattle thieves’, beef smuggler’ and ‘cattle trader’. Where information was incomplete, we spoke to the journalists who filed the original reports.


Muslim victims were identified by name. In 8% of the 63 cases, the reports explicitly stated that those attacked were Dalits, who are also targets because many among them clear cow carcasses, skin them and eat beef. In a few cases, religion was difficult to determine.


In 50.8% (32) of the cases, the targets were Muslim, in 7.9% (5) Dalit, 4.8% (3) Sikh or  Hindu (names appeared Sikh, but it wasn’t certain) and 1.6% (one) Christian; in 20.6% (13) cases, religion was not reported. Among 14.3% (9) cases, the targets were Hindus, but their caste was not clear.


Police officers and onlookers were injured in 8% (5) of the attacks; 27% of those targeted were women.


Note: This study was built around searches in English-language media and may omit cow-related violence reported only in Hindi and other language media. A cursory search through Hindi media appeared to throw up the same incidents.


“Lynching does not find mention in the Indian Penal Code. No particular law has been passed to deal with lynching,” India Today noted on June 25, 2017. “Absence of a codified law to deal with mob violence or lynching makes it difficult to deliver justice in the cases of riots. However, Section 223(a) of the Code of Criminal Procedure, 1973 says that persons or a mob involved in the same offence in the same act can be tried together. But, this has not proved to have given enough legal teeth to (the) justice delivery system.”


In a fifth of the cases, police registered cases against victims/survivors


Of the 63 attacks over eight years, 61 (96.8%) occurred, as we said, after Modi’s government came to power (2014-2017), with 2016 reporting the most attacks: 25. In the first six months of 2017, 20 attacks were reported–more than 75% of the 2016 figure.


In 5% of the attacks, there was no report of attackers being arrested. In 13 attacks (21%), the police registered cases against the victims/survivors.


Note: Data as of June 25, 2017. Compiled by IndiaSpend from media reports.


In 23 attacks, the attackers were mobs or groups of people who belonged to Hindu groups, such as the Vishwa Hindu Parishad, Bajrang Dal and local Gau Rakshak Samitis.


During the period under consideration–2010 to 2017–the first such attack occurred on June 10, 2012, in Joga town in Mansa district, Punjab, “after carcasses of about 25 cows were found” near a factory, as the Hindu reported the next day.


“Led by activists of the Vishwa Hindu Parishad and the Gowshala Sangh, villagers gathered in the morning and broke into the premises of the factory…The mob went on the rampage damaging the factory and setting ablaze the houses of at least two of those running the unit, Ajaib Singh and Mewa Singh,” the report said. Four persons were injured and three arrests were made in the case.


In August 2016, in Mewat, Haryana, a woman and her 14-year-old minor cousin were allegedly gang-raped after being accused of eating beef. Two other relatives were murdered. The woman later denied eating beef. Four men were arrested and charged with rape and murder.


In June 2016, Gurgaon Bajrang Dal convener and a Gau Raksha Dal (cow protection group) volunteer were injured when men transporting cows opened fire. Abhishek Gaur and Harpal Singh, the gau rakshaks, chased a vehicle in which smugglers were allegedly transporting beef. A case of attempt to murder was filed against the unidentified smugglers.


In January 2016, Maharashtra amended its 2015 beef ban law–banning people from possessing the meat of cows, bulls and bullocks, slaughtered within or outside the state. However, serving beef in restaurants across the state was allowed. Two cow-terrorism attacks were reported from the state, India’s richest by gross domestic product, in 2017.


Andhra Pradesh, Assam, Himachal Pradesh, Kerala, Odisha, Tamil Nadu and Bihar reported one attack each.


On May 30, 2017, a PhD scholar in Indian Institute of Technology, Madras, was at one of the vegetarian messes on campus, when he was attacked–allegedly for eating beef. An FIR was registered against the alleged attacker, while the scholar was booked based on a complaint by the alleged attacker who termed the incident a ‘minor scuffle’.


Rumours spawned 52% of the attacks


Of the 63 attacks since 2010, 33 (52.4%) were based on rumours, according to our analysis of media reports.


On April 1, 2017, 55-year-old Pehlu Khan, a resident of Haryana, was beaten by cow vigilantes in Rajasthan’s Alwar district. He succumbed to his injuries in a hospital two days later.


Azmat (age 22), who was with Pehlu Khan, said that they were returning from a Saturday fair in Jaipur, where they bought two cows and had all the valid documents, as the Indian Express reported on April 5, 2017.


A group of people affiliated with Vishwa Hindu Parishad and Bajrang Dal stopped four vehicles, near Jaguwas crossing on National Highway eight, and alleged that they were illegally transporting bovines.


On hearing a Hindu name, the attackers allowed the driver, Arjun, to run away and attacked five people in the vehicles including Pehlu Khan, according to reporting by Scroll.in. All five were beaten and severely injured, the Indian Express reported.


On June 11, 2017, despite having a no-objection certificate (NOC) and official permission from police and other authorities, officials of the animal husbandry department of Tamil Nadu’s government were attacked by cow vigilantes in Rajasthan for transporting cows in five trucks. They were rescued by the local police. A case was registered against 50 attackers and four were arrested. Seven policemen were charged with dereliction of duty, the Indian Express reported on June 12, 2017.


(Abraham and Rao are interns at IndiaSpend.)


We welcome feedback. Please write to respond@indiaspend.org. We reserve the right to edit responses for language and grammar.

__________________________________________________________________

“Liked this story? Indiaspend.org is a non-profit, and we depend on readers like you to drive our public-interest journalism efforts. Donate Rs 500; Rs 1,000, Rs 2,000.”


UP Plans Cow Shelters In Jails 69% Overcapacity, 33% Short Of Staff

$
0
0

prisons_620


The jails of Uttar Pradesh (UP), overcrowded and understaffed, are in no position to house gaushalas (cow shelters) as the state government recently proposed.


The prisons of India’s most populous state are 69% over capacity–compared with the national average of 14%–and have only two-thirds of the staff they need, according to 2015 prison statistics, the latest available with the National Crime Records Bureau (NCRB).


The capacity of jails across UP is 49,434, but they hold 88,747 inmates, the data reveal. Nationally, the figures are 366,781 and 419,623, respectively.


The highest occupancy rate was reported in Dadra & Nagar Haveli, 277%, more than any other state and union territory, followed by Chhattisgarh (234%) and Delhi (227%).


Source: Prison Statistics 2015, National Crime Records Bureau


Enough manpower to manage prison, prisoners and cows?


“We have manpower and most jails have adequate land to set up gaushalas. Naini Jail in Allahabad already has a gaushala,” minister of state for jails Jai Kumar Singh had said of government plans for jail gaushalas. “We are looking at the possibility of starting gaushalas in other jails. Our plan is to run them with a little grant from the government and utilise the assistance from social workers and citizens.”


There is a 33% shortage in jail staff in UP. Of a sanctioned strength of 10,407, 6,972 (67%) posts are filled. The national shortage is 34%, according to 2015 NCRB data.


Bihar is most starved of prison staff–it has 2,654 personnel while it needs 7,860, a shortage of 66%, followed by Delhi (47%) and West Bengal (41%), IndiaSpend reported on November 11, 2016


UP has more undertrials than any state


In absolute numbers, UP had the highest number of undertrials (62,669), followed by Bihar (23,424) and Maharashtra (21,667), according to 2015 NCRB data. In Bihar, 82% of prisoners were undertrials, the highest among states, the data further reveal.


More than 25% of undertrial prisoners in 16 out of 36 states and union territories have been detained for more than one year in 2014; Jammu and Kashmir leads this list with 54%, followed by Goa (50%) and Gujarat (42%), and UP leads in terms of sheer numbers (18,214), IndiaSpend reported on October 17, 2016.


Furthermore, human rights activists have often raised the subject of the living conditions of prisoners in jails.


Since 2013, the Supreme Court has been hearing a suo motu case involving inhuman conditions in 1,382 prisons in India. In this case, the bench comprising of justices Madan B Lokur and RK Agrawal issued directives to all states in February, as The Wire reported on April 11, 2016.


(Saha Saha is an MA Gender and Development student at Institute of Development Studies, University of Sussex.)


We welcome feedback. Please write to respond@indiaspend.org. We reserve the right to edit responses for language and grammar.

 
__________________________________________________________________
 

“Liked this story? Indiaspend.org is a non-profit, and we depend on readers like you to drive our public-interest journalism efforts. Donate Rs 500; Rs 1,000, Rs 2,000.”


How Smaller, Decentralised Solutions Can Help India Meet Its Social-Development Goals

$
0
0

SDGs_620


“Indian farmers are dependent on electricity for irrigation. Electricity is mostly available only at night, supply is interrupted and the voltage fluctuates. Solar pumps provide electricity throughout the day and supply is uninterrupted, making them a good alternative to traditional irrigation practices”, said Prof. Tushar Shah, Director, International Water Management Institute, Gujarat.


Relying on large, centralised programmes such as Swachh Bharat Mission and National Rural Drinking Water Programme to provide universal access to basic necessities would require 30-40% more government spending than current levels over the next 15 years, an analysis by Dalberg, a global strategy and policy advisory firm focused on social impact, shows.


Instead, Dalberg suggests, decentralised solutions can supplement these efforts and plug the gaps, often at a fraction of the expense and time that conventional methods entail.


Supplementing conventional efforts with smaller, decentralised solutions is imperative when viewed in the light of the fact that India needs to spend Rs 64 lakh crore ($1 trillion) up to 2030 to provide universal access to water, electricity and sanitation–an amount greater than three times the country’s total budgeted spending for 2016-17 (Rs 19.78 lakh crore).


The scale of the problem


Millions in India lack access to basic utilities. Between 63.4 million and 78 million Indians–more than in any other country of the world–live without access to safe drinking water, according to various estimates. However, Dalberg believes the real figure is close to a billion–when safe drinking water is taken to mean water treated with proper filtration methods, as against “improved water” that means water safe from contamination by human and animal waste, which may yet be unfit for human consumption.


More than 200 million people have no access to electricity, and more than 500 million Indians practice open defecation.


The economic burden of poor sanitation alone was estimated to be more than Rs 6.4 lakh crore ($100 billion) in 2015, with most of it falling on women and children belonging to the base of the pyramid population, in a report published by the Japanese building material manufacturer LIXIL Group Corporation, UK-based NGO Water Aid, and global advisory firm Oxford Economics.


Government targets and action


The United Nations-led Sustainable Development Goals (SDGs) initiative has set ambitious targets for developing countries to achieve by 2030, among them SDG 6 (to “ensure availability and sustainable management of water and sanitation for all”) and SDG 7 (to “ensure access to affordable, reliable, sustainable and modern energy for all”) under which India is committed to providing universal access to basic services.


The government has initiated various programmes to this end, including, for example, the Swachh Bharat Mission, the National Rural Drinking Water Programme, and the Grameen Vidyutikaran programme.


Financing shortfall likely


However, given the immense investment required, these efforts are likely to fall short. For instance, a Dalberg analysis of government spending on water and sanitation indicates a financing shortfall of 30-40% until 2030 if the government continues to spend as it is doing currently.


Further, given the constraints of government institutions combined with an expanding population, more than half a billion Indians are likely to still lack access to safe water, electricity, and sanitation services by 2030.


How decentralisation can help


Decentralised solutions can complement centralised utility services–where government systems currently do not exist, they can be the primary service providers; in areas where government services exist but do not perform at desired levels, decentralised systems can be last-mile service delivery providers.


For example, social businesses that operate water kiosks are bringing safe water to communities that lack access to centralised water pipelines. Water purification businesses offer solutions where government pipelines exist but water is not potable.


Decentralised systems are also more cost-effective. For example, Dalberg analysis of primary data collected from seven water-kiosk enterprises across Asia, Africa and Latin America shows that water kiosks require less than 50% of the funding needed to bring safe water to currently underserved households in the conventional manner, which entails laying water distribution pipelines, treatment systems, and connection costs to private/public taps.


Likewise, small mini-grid systems that cost as little as Rs 64,000 ($1,000) can bring electricity to rural villages often located in isolated areas, obviating the need for distribution lines, transformers, switching equipment and last-mile connection such as wiring households. For the sake of comparison, a basic distribution line and transformer cost more than Rs 200,000.


Increasingly, decentralised solutions are finding a way to plug the gaps left by centralized systems across sectors. These solutions offer shorter turnaround times for new setups (e.g., one or two weeks to set up a new solar energy-based micro-utility), and better control over the maintenance and quality of service provided (e.g., through closer engagement and accountability within the local community).


Ecosystem-level challenges


However, private sector efforts face several ecosystem-level challenges that increase business risk and make it difficult to scale delivery. Financing from formal institutions is scarce due to the associated business risks. Limited regulatory controls lead to sub-quality products and cheaper substitutes. The policy environment is uncertain–for example, the future of water kiosks remains uncertain if government pipelines are extended or a tariff ceiling is enforced.


Customer behaviour towards utilities poses further challenges. Field research conducted by Dalberg covering households, service providers and government institutions in Asia, Africa and Latin America throws up a consistent finding: People consider basic services such as water, sanitation and electricity as core government mandates and expect the government to provide and subsidise them.


Therefore, services delivered through decentralised models are not readily accepted. Decentralised service providers face the enormous task of creating a market for their services, while also running and growing their businesses sustainably in a challenging environment.


Designing an optimal mix


How then to design an appropriate mix of centralised and decentralised solutions to ensure universal access to basic services?


Three elements are essential. First, there must be a clear strategy based on complementarities and substitution. For example, delineating the role for mini-utilities in scenarios where centralised government services are present and where they are not.


Second, the operating framework must be clear. For instance, laying out policy and regulatory regimes for decentralised mini-grids will remove business uncertainty and fuel more private investment.


Third, the perspective has to be user-centric and committed to minimum standards, allowing public officials the freedom to stitch together a solution. For example, setting the benchmarks for service levels for faecal sludge management but empowering and encouraging panchayats and urban local bodies to engage the private sector to deliver services.


Update: The story has been updated to include the World Bank’s estimate of the number of Indians living without access to safe drinking water.


(Bhatnagar is an Associate Partner and Goyal a Senior Project Manager at Dalberg, a global strategy and policy advisory firm focused on social impact.)


We welcome feedback. Please write to respond@indiaspend.org. We reserve the right to edit responses for language and grammar.

 
__________________________________________________________________
 

“Liked this story? Indiaspend.org is a non-profit, and we depend on readers like you to drive our public-interest journalism efforts. Donate Rs 500; Rs 1,000, Rs 2,000.”


One Nation, One Tax: 5 Things You Should Know Ahead Of GST Rollout

$
0
0

gst_620

The government is all set to roll out the goods and services tax (GST) at the stroke of the midnight on June 30, 2017.


All states/union territories, except Jammu & Kashmir, have approved the state goods & services Act (SGST) for ensuring the roll out.


Benefits Of GST
Trade Consumers
Reduction in multiplicity of taxes Simpler tax system
Mitigation of cascading/double taxation Reduction in prices of goods & services
due to elimination of cascading
Development of common national market Uniform prices throughout the country
Simpler tax regime Increase in employment opportunities

Source: GST Council


Here are five things you must know ahead of the big change in indirect taxation across the country


1) What exactly is GST?


GST is paid when a consumer buys something (even a company buying inputs). The tax is levied on every transaction in the supply of goods and services, barring certain exempted items such as petroleum products. The tax levied at one stage can be set off or deducted from the tax to be paid at the next stage.


India has a dual GST–Central GST (CGST) and State GST (SGST). There is also an integrated GST (IGST) on the inter-state supply of goods and services, which can be set off against CGST and SGST that is to be paid.


From July 1, 2017, India will move to a one-tax, one-nation regime. All goods and services will be taxed under one of four slabs–5%, 12%, 18% and 28%–wherever they are purchased.


2) Who decides GST rates?


The GST Council including the union finance minister (who will be the chairman of the council) and the state finance ministers will finalise the GST rates.


3) Where do you register for GST?


The Goods and Services Tax Network (GSTN), a non-government, private company with the central government holding 24.5% stake, will provide IT infrastructure and support services to the governments, taxpayers and other service providers for the implementation of GST.


4) Relaxation in rules for two months


The GST council has relaxed the tax filing norms for two months–July & August, 2017–for those still maintaining manual records or in the process of GST transition.


The council has finalised a simplified form instead of invoice-wise returns, according to this release by the Central Board of Excise & Customs, the government department overseeing the implementation of GST. There would be no late fees or penalties for late returns, and regular returns would need to be filed from September.


Accounts & Records In GST Regime
1) Compliance verification in GST will be done
through examination of accounts and records maintained, only if required
2) One tax, one type of record: No need to
maintain separate records for different taxes like value added tax, Excise
& Service Tax
3) The required records are:
a) All records of goods and services that a
person supplies or receives in the course of his business;
b) All records of goods imported;
c) Any other supporting documents such as
contracts and price quotation to show liability to GST
4) Taxable persons with turnover of less than
Rs 2 crore are not required to get their accounts audited or submit
reconciliation statement with annual returns

Source: GST@GoI


5) Which items are covered under GST and which are not subject to GST?


Daily use consumer items such as cereals, pulses, dairy produce, fresh meat, fish, fresh vegetables and fruits are all exempt from GST, according to government data.


Education and skill development services have also been granted exemption, official data show.


Alcoholic drinks, electricity and five petroleum products (crude oil, petrol, diesel, natural gas and aviation turbine fuel) are out of the purview of GST. These will continue to attract VAT and central excise. The petroleum products have been excluded only temporarily.


We welcome feedback. Please write to respond@indiaspend.org. We reserve the right to edit responses for language and grammar.

 
__________________________________________________________________


“Liked this story? Indiaspend.org is a non-profit, and we depend on readers like you to drive our public-interest journalism efforts. Donate Rs 500; Rs 1,000, Rs 2,000.”


Conversion To Buddhism Has Brought Literacy, Gender Equality And Well-Being To Dalits

$
0
0

dalit_620


There are more than 8.4 million Buddhists in India and 87% of them are converts from other religions, mostly Dalits who changed religion to escape Hindu caste oppression. The remaining 13% of Buddhists belong to traditional communities of the north-east and northern Himalayan regions.


Today, these converts to Buddhism–also called neo-Buddhists–enjoy better literacy rates, greater work participation and sex ratio than Scheduled Caste Hindus, the group from which most converts emerge, according to an IndiaSpend analysis of 2011 Census data.


Given that converts make for 87% of the Buddhist population in India and most of them are Dalits, our analysis goes with the assumption that the benefits of growth in the community accrue mostly to the Dalits.


Buddhists have a literacy rate of 81.29%, higher than the national average of 72.98%, according to Census data. The literacy rate among Hindus is 73.27% while Scheduled Castes have a lower literacy rate of 66.07%.


“Most Dalits at the senior levels of administration are Buddhists,” said Satpal Tanwar, a leader of Bhim Army, the activist organisation accused of the Saharanpur violence of May 5, 2017, and now mulling mass conversion of Dalits to Buddhism. “This is because Buddhism lends them self-confidence as compared to the caste system which tends to rationalise their low social status through vague concepts like bad karma.”


Better literacy rates


It is only in the traditional communities of the northeast, especially in Mizoram (48.11%) and Arunachal Pradesh (57.89%), that Buddhists have a lower literacy rate than the population average.


On the other hand, Chhattisgarh (87.34%), Maharashtra (83.17%) and Jharkhand (80.41%) have the most number of literate Buddhists. The conversion movement has been the strongest in Maharashtra, followed by Madhya Pradesh, Karnataka, and Uttar Pradesh.


Source: Census 2011; Note: Figures as percentage of population


Maharashtra’s story is unique because it has the highest proportion (5.81%) of Buddhists in its population than other Indian states–more than 6.5 million. It was the home state of  BR Ambedkar’s where he, along with 600,000 followers, switched to Buddhism in 1956. This form of protest against casteism continues to this day though, as IndiaSpend reported on June 17, 2017, the growth rate of such conversions is declining.


In Uttar Pradesh, 68.59% Buddhists are literate, higher than total population average (67.68%) and nearly eight percentage points higher than the figure for other Scheduled Castes (60.88%).


Better gender parameters


Female literacy among Buddhists in India is also considerably higher (74.04%) than the total population average (64.63%), data show. Among neo-Buddhist states, only Uttar Pradesh (57.07%) and Karnataka (64.21%) show female literacy rates lower than total population averages, but these are still considerably higher than Scheduled Castes in these two states.


Source: Census 2011;

NOTE: Figures as percentage of female population


In 2011, the sex ratio among Buddhists is 965 females per 1,000 males as compared to 945 for total Scheduled Castes. The national average sex ratio was 943. Buddhists also tend to have fewer children.


The Census 2011 data shows that there are 11.62% children in 0-6 year age group among Buddhists compared to 13.59% national average. This means, for every hundred population, Buddhists have two children less than the average.


But can it be said that neo-Buddhists are more inclined towards education than Dalits? Or is there a greater possibility that Dalits turn to Buddhism after attaining education?


Around 43% of Buddhists stay in urban areas as compared to total population average of 31%, which also increases their chances of being educated. But the reality is not simple.


Around 80% Buddhists are from Maharashtra, which has better literacy and urban ratio than the national average. Within Maharashtra, the literacy rate, urbanisation levels and child ratio among Buddhists is slightly better than for other groups.


The Maharashtra story: How the Mahars found a better life


The development among Maharashtrian Buddhists can be attributed to Ambedkar’s call for education and certain social conditions.


Ambedkar was from the Mahar community which had little agricultural land and no fixed traditional occupation in a village society. They often stayed on the periphery of their villages and acted as watchmen, messengers, wall menders, adjudicators of boundary disputes, street sweepers and so on.


This flexibility of profession ensured that Mahars were more mobile than others. Many of them, including Ambedkar’s father, joined the British Army. Even before Ambedkar embraced Buddhism, he asked the Dalits to take to education.


“Lack of farm land or traditional occupation made it easy for Mahars to take to education as the means for gainful employment,” said Nitin Tagade, assistant professor, Savitribai Phule Pune University, who has studied the economic condition of Maharashtra’s neo-Buddhists. “So, they had a head start as compared to other communities in attaining education and moving to cities.”


Around 47.76% Buddhists stay in cities compared to the Maharashtra state average of 45.22%, according to Census 2011. Among those in rural Maharashtra, most working Buddhists continue to be agricultural labourers (67%), which is much higher than the rural population average of 41.50%.


Their improved social status through education has helped neo-Buddhists contribute more to the national economy than Scheduled Castes. Their work participation ratio (43.15%) is higher than of total Scheduled Castes (40.87%) and higher also than the national average (39.79%).


(Moudgil is an independent journalist and the founder-editor of GoI Monitor, a web magazine on grassroots and development.)


We welcome feedback. Please write to respond@indiaspend.org. We reserve the right to edit responses for language and grammar.

 
__________________________________________________________________
 

“Liked this story? Indiaspend.org is a non-profit, and we depend on readers like you to drive our public-interest journalism efforts. Donate Rs 500; Rs 1,000, Rs 2,000.”


Private Smarts, Public Spread: Anil Swarup’s Prescription For India’s Education Woes

$
0
0

anil_620


Though India has almost universal enrolment in primary school, learning outcomes continue to be poor, with many children dropping out before secondary school. Anil Swarup, secretary of India’s department of school education and literacy, believes that the key to solving the problem lies in using the government sector to scale and replicate successful models from the private or public sector.


“The government sector gives you the scale. The private sector gives you the quality and that’s where the two should work in tandem to have scale and quality,” said Swarup, previously secretary in the ministry of coal, and director general of labour welfare in the ministry of labour and employment.


India has over 250 million children between the ages of six and 15, according to the latest projections by the Ministry of Human Resource Development. By 2030, India will have the world’s largest working age population–1.03 billion–a demographic dividend that will bear fruit only if the population is healthy and productive, with education playing a key role.


In 2015-16, 87.3% of the Indian primary school-age population was enrolled in school, up from 84.53% in 2005-06. About 51% of the secondary-age population was enrolled in school in 2015-16, up from 41.9% in 2012-13 (the latest available data), according to data from the District Information System for Education.


Though India has been successful in getting children to school, learning outcomes have been consistently poor. In 2016, about 25% of children in grade III could at least read a grade II level text, while 27.7% of children in grade III could subtract, according to the Annual Status of Education Report, a household based citizen-led survey.


Education is on the concurrent list, which means both the central and the state government have a role in providing good quality education.


IndiaSpend spoke to Anil Swarup about the government’s education priorities, the role of the central government in improving education quality, and the role of the ministry of human resource development in helping a child learn from early childhood to adolescence. Here are edited excerpts from the interview.


Q: When do you think India will reach a point when a majority are literate?


I’m not a person who predicts things. I’m more into the present. What needs to be done now, I’ll do that. I have no control over the final results. There are people who project, you can ask them, and then you can question them whether it has happened or not. I’ll not be there then, so I won’t be able to answer. I would rather answer on things I am doing in the present. And I love it that way.


Q: What are your priorities in the education sector for the next few years?


We have looked at the education sector and we believe that we have been able to get the child to the school. The effort now would be to impart quality education to the child. And in doing so, we have looked at the primary cause of it not happening, and we believe the pivotal role has to be played by the teacher.


We will start with the entry of people into colleges that impart bachelor of education (B.ed.) degrees (mandatory for becoming a school teacher up to grade XII in India). Right now, some places have tests, others don’t. So one would be to see if we can have a test for entry into colleges so that only those who are genuinely keen on getting into this profession get into these colleges.


The second is the quality of colleges itself which leaves a lot to be desired. So we are looking at whether we could accredit these colleges to improve the quality of education imparted.


Number three is when people graduate from college. We are looking at how we can have a central exam in the form of CAT and SAT, wherein there is a greater objectivity in deciding who qualifies as a teacher.


Once the teacher gets selected, there is an induction course but it is very short, and in some places there is no induction course. We are looking at a compulsory induction course for a longer duration to equip the teacher to do what we want them to. Once the teacher is in school we are trying to understand how we can continuously upgrade their skills through training processes.


Q: Parental literacy is associated with higher enrolment of students in school, and better learning outcomes. About 30% of Indian adults above the age of 15 years were illiterate, according to Census 2011, the latest available data on nationwide literacy. What is the government doing for adult literacy?


The understanding of adult literacy has undergone a sea change over the years. There was a period of time when children were out of school and so it was essential for adults to be educated separately. Now with most children in school, the approach will have to be children teaching the parents. And I have seen it myself. I have travelled to a place called Sukma in Bastar. I had the occasion to go down and walk to the school where a parent-teacher meeting was ongoing. I was very pleasantly surprised to find so many parents sitting there. I asked one of the parents: “why do you send your child to the school?” He said, “Main to padh nai paya. Ye padh lega thodasa” (I couldn’t study but my child will be able to study a little). Then I asked the second parent who said:“Yeh padh lega to mujhe bhi padha dega” (if my child learns, s/he will teach me too). That’s where I started looking for answers in terms of adult education.


If the parents can be associated with the learning of the child, it serves two purposes: The purpose of the child to learn and the the purpose of the parent to learn from the child. I think the approach towards adult literacy, which was earlier teaching them directly, could now be through the child. As you go along, more and more people will become literate. It’s not an easy job. But with this approach, I don’t have to go to a third party to educate a parent, as was the case earlier in the national literacy mission. We engage NGOs and people who want to teach. That exercise too may continue; but I think the approach now more would be through the child himself.


Q: There is evidence that good quality early childhood education improves student learning outcomes in school (and later in life). What is the ministry doing to ensure that children get good pre-school education, and start school with similar levels of knowledge?


We have so far focussed on grades one to eight under the Right to Education (RTE) Act. The RTE doesn’t talk about pre-school. So we are now thinking how we can bring in anganwadis (courtyard shelters) under schools. This experiment has already started in some states. I have seen it myself in Rajasthan where it is working wonderfully. They have shifted anganwadis and pre-schools in the same premise as the school, and it is having the desired impact. Let’s see how it evolves. In five workshops that we had with state governments we took the Rajasthan model and told other state governments about it, and many states are very seriously considering it.


First you physically get the anganwadi to be a part of school, and then see what other additional inputs are required before students come to grade I. I mean there is no ‘cut and dry’ formula that is ready, you put it there and it will happen. So Rajasthan is doing this experiment, let’s see how it works.


In terms of parents not taking children to an anganwadi, it is more of a social problem. But I think it is changing quite substantially, especially in the context of education. People have become much more aware about child learning. They want them to be educated.


But we are still concerned that if we don’t take care of pre-school, there can be problems later. Suddenly when children come to grade I, they don’t know the things they should already be aware of.


Q: What do you think the government can do to bring children, already in school, to the same level of learning? Some studies have found that children in one grade can often span several grades in terms of learning levels.


There are schemes through which you address such issues of bringing a child to a particular level, and many states are implementing schemes too. Even within a class, you don’t have every child of the same standard. Teachers assess the child, form groups based on the level of the child, and then provide different inputs to different groups. That’s how the pedagogy has evolved. You don’t shout the same thing to every child. There would be few things same for everyone but select children would be given a separate set of inputs.


Q: One survey found that about 29% of students enrolled were absent from class on the day of the survey. What do you think can reduce absenteeism?


It’s the same issues of quality. If there is joyful learning and if you improve the quality of education, the child will come. For example, I have seen both types of schools–where there is poor attendance and where there is cent % attendance–on surprise visits. All the difference was the quality of education and the manner in which education was being delivered. I drove down from Pune to Goa for 10 hours and kept getting down at schools and I was pleasantly shocked; children were involved in the education process because they enjoyed what they were doing. For example, in one school, I saw a container of sand and this child was learning how to write in sand. He was writing letters and there were other children standing around. It’s fun for them. There are many such examples. It’s a question of whether we are making learning a joyful exercise.


Q: Government figures show one in six teaching positions in government schools is vacant, a collective shortage of a million teachers. How is the government tackling this problem?


You can’t pick a single institution where you would say all the seats are filled. There could be some shortage of teachers but it has more to do with deployment of teachers or redeployment of teachers. I don’t foresee a situation where I can say all teacher posts are filled. There are some states, I won’t name them, in which a large number of teachers are attached to headquarters doing nothing. There are other states with schools where there are hardly any children but teachers are deployed. There are lots of steps like consolidation of schools so that the same number of teachers could be used more fruitfully.


I don’t think availability of teachers is that big an issue though it is still an issue. The point is that the teacher that is available and the infrastructure that is available, how best it can be put to use. That’s what we are looking at.


Q: A recent study across four states found that teachers were absent more often because of official duties than because of truancy. What are your thoughts on that?


That study may have been conducted but it’s fact that, it’s truancy, it’s not work. So we are trying to handle that through a project that we launched in the entire state of Chhattisgarh. We will supply tablets which will be GPS-linked and biometric attendance of the teacher will be taken. We will see the impact, whether it improves the attendance of the teacher in the school. Because until the teacher is present you can’t do anything about education.


We are also looking at reducing the burden of the teacher in terms of sending information so that he or she has more time to educate the child rather than filling forms. The tablet we have in mind would also be used for housing and sending information from each school which will be much less cumbersome than the present way.


We would also use the tablets to upgrade the skills of teacher by using audio-visual, pre-recorded material.


Q: One study shows that between 2010-11 and 2015-16, student enrolment in government schools across 20 Indian states fell by 13 million, while private schools acquired 17.5 million new students. Why is that the case, and what is the government doing to keep students in government schools?


It was simply on account of the perception of people that the quality of education provided by the private school is better than government schools though data doesn’t prove that. If you actually see CBSE (Central Board of Secondary Education) results, government schools have performed better than private schools. (In 2017, 82.2% of grade XII government school students who took the Senior School Certificate Examination across 10 districts succeeded, while 79.2% of those in “independent” private schools did, and 25.4% of those in schools classified as “private” did.) So it’s a perceptional issue. Other historical issues exist in terms of our understanding of the language English. It is somehow assumed that a private school teaches English, and English will give people jobs. It may not be totally correct but that’s a perception.


To rectify that, the attempt is to improve the quality of education. Here again, both Maharashtra and Rajasthan have clearly demonstrated that, if the quality of government schools improves people start coming back and there the trends are absolutely amazing. I have seen it myself–how children who had gone to private schools have come back. It is happening in isolated cases but it’s a good case case study to be replicated across states.


(Enrolment in government schools in Maharashtra fell 4.1% between 2014-15 and 2015-16, while private school enrollment grew 1.2%, according to DISE data. In Rajasthan, government school enrolment grew 5.5% in the same period, and private school enrollment reduced 0.1%.)


Q: What is the government doing to reduce dropouts from school, especially before secondary school, given that enrolment in secondary school is much lower than in primary school?


A number of studies give a number of reasons. For example, girls drop out because they are required at home to take care of their younger siblings. The other reason is when a child grows, he doesn’t like what is being taught in the school, so he drops out. Then, health issues are there. So there are variety of issues and all need to be addressed.


Fortunately, a lot of NGOs have been working to reduce dropouts. For example, Educate Girls has launched a campaign in a number of districts in Rajasthan to reduce dropouts which is going very well. We are looking at that and other models, and making presentations in other states, and some of them are engaging these NGOs to see how they could be used. Similarly, there are NGOs looking at out-of-school children, and how they can be brought in. So we are trying to demonstrate that there are models where such problems are being solved. But it is being done in small pockets.


We have held a seven-day long workshop here interacting with more than 100 NGOs–what they have done, how they have done it, what is its impact and how they can replicate it, and in replication or scaling what exactly do they expect from the state and central government. And believe me, this scaling is happening at a much faster pace than expected. So they are going to other states, they are signing more schools. What has actually happened is they have started believing that they don’t need to restrict themselves to a particular area. Other states are willing to have them because they have seen good work being done. So as I often say: The government sector gives you the scale. The private sector gives you the quality and that’s where the two should work in tandem to have scale and quality.


Q: How does the schooling system ensure that education can help students be more employable?


What we are talking in terms of study in grades I to V or I to VIII is not employability. We are making him a student who learns. Employability will come from what he does in grades IX, X, XI, XII and after. So that’s where we are trying to get vocational training as a part of curriculum that has already been done. The approach that we are now trying to adopt is that vocational training should be suited to the requirement of that area. So, like in Delhi, we feel that if you train him in some IT (information technology) application, they will be employed. Doing that in a remote village in Keonjhar district, that won’t happen.


What we are trying to do is–and Wadhaani Foundation is helping us here–a survey with regard to what is the employment requirement of the next five years. And accordingly structure the vocational training. So it will be demand-based rather than supply-based. You train anybody in something, and he is not employed. So probably in hospitality sector it will be more beneficial in Odisha than in the IT sector. Geriatric care might be something that is required. New sectors are emerging, and through the survey we get to know what is the requirement. So now we are trying to do this, and a couple of experiments have succeeded in actually determining what the requirement is.


Q: What is the central government’s role in bringing innovative methods of teaching to schools?


My job, when I travelled to the states, was to find such models. We launched five national workshops where these models were displayed for states, so that they could be scaled and replicated.


My job is, as I call myself, of a principal facilitator. Identify, recognise and road show the good work. And once other states know, they can adopt it. I’m creating platforms where they can see the models. You know a guy sitting, say, in Rajasthan would not know what is happening in Maharashtra. But I know that’s happening in Maharashtra so if I do a workshop in Pune and call the Rajasthan guys over and take them around, there is no reason why they will not adopt it. Similarly when the Maharashtra people, say, see the anganwadi in Rajasthan and the children coming to school, they will adopt it. These ideas are not imported from Finland, England, Swaziland or Poland, they are homeland ideas where these models are implemented. Nothing else can carry more conviction.


For example, I drove about 120 km north of Thane to a place called Pastepada. There was this teacher–32 years old–in a school with no electricity, and he has digitised the whole learning process. There are tablets, digital smart screens. He has raised the funds from around the school. And that’s not the story. The story is that it’s not one school, but that it’s being replicated in 47,000 schools in Maharashtra. That’s the story. So it’s a replicable model, it’s a scalable model. We can have a great thing at one place but that’s not it. The challenge is whether it can be scaled. That is our role.


(Shah is a reporter/writer with IndiaSpend.)


We welcome feedback. Please write to respond@indiaspend.org. We reserve the right to edit responses for language and grammar.

 
__________________________________________________________________
 

“Liked this story? Indiaspend.org is a non-profit, and we depend on readers like you to drive our public-interest journalism efforts. Donate Rs 500; Rs 1,000, Rs 2,000.”


Why 581 Million Indians Endure India’s Worst Healthcare

$
0
0

healthcare_620


Nine of India’s poorest states–home to 581 million or 48% of India’s population–account for 70% of the country’s infant deaths, 75% of under-five deaths and 62% of maternal deaths, but do not spend even the money they have set aside for healthcare, according to an IndiaSpend analysis of 2017 Reserve Bank of India data on state budgets.


The data also reveal:


a. The maternal mortality ratio–deaths of mothers per 100,000 births–in these states is 32% higher (244) than the national average (167).


b. 38% and 40% children in these states are underweight (low weight-for-age) and stunted (low height-for-age), respectively, higher than the national average of 36% and 38%, respectively, according to 2015-16 national health data, the latest available.


c. Uttar Pradesh, Bihar, Madhya Pradesh and Rajasthan–with 372 million people, more than the combined populations of US, Australia, Sweden and Greece–together contribute to about 58% of all child deaths in India.


The nine poorest large states–in official jargon called “high-focus”, a term that implies they need special attention–spent an average of 4.7% of their social-sector expenditure on public healthcare and family welfare annually, marginally less than the national average of 4.8%. Social-sector expenditure includes water supply and sanitation, housing and urban development.


NOTE: * – Actual Figures; ** – Maternal mortality ratio in these states (Andhra Pradesh, Himachal Pradesh, Jammu and Kashmir, Manipur, Meghalaya, Mizoram, Nagaland, Sikkim, Telangana and Tripura) is 126 deaths per 100,000 births as per the Sample Registration System (SRS) Report published in 2011-13


India’s average spending on health, as a proportion of gross domestic product, is already the lowest among BRICS nations, as IndiaSpend reported on May 8, 2017.


The “high-focus” states are Bihar, Chhattisgarh, Jharkhand, Madhya Pradesh, Odisha, Rajasthan, Uttarakhand, Uttar Pradesh and Assam.


“In 2005, it was observed by (the) government of India that some states were performing poorly in various indicators,” Avani Kapur, senior researcher, Accountability Initiative, an advocacy, told IndiaSpend. “So, these states were clubbed together as high-focus states and additional resources were given to improve those indicators.”


Poorest states spent less money than their budgets allowed


Of the nine poorest states, Rajasthan spent the highest (5.6%) and Bihar the lowest (3.8%) proportion of aggregate expenditure on public healthcare and family welfare, according to the RBI data on 2014-15 actual spending, lower than the budgeted 4.1% for Bihar and 6.6% for Rajasthan.


Seven of the nine “high-focus” states report such underspending.


“High focus states allocate large amounts to social sector to improve their indicators but in reality they spend only a small amount, compared to what is allotted,” Kapur said. “Hence, it is necessary to consider actual accounts in order to know the proper outcomes.”


So, while some “high-focus” states spent less money than set aside by their
budgets, other states outspent–by proportion as ratio to aggregate expenditure–other larger states on healthcare and family welfare, but that had no relation to their healthcare indicators.


For instance, Rajasthan (68.6 million people) reported an MMR of 244 deaths per 100,000 births in 2011-13, the second lowest in India and worse off than Bangladesh and Nepal, both poorer countries, by per capita income. In contrast, Andhra Pradesh (84.6 million people), another big state, spent 4.1% of total expenditure on public healthcare and family welfare but reported  an MMR of 92, according to government data.


Since 2008, Rajasthan increased its spending by 0.8% and its MMR decreased 23% while Andhra Pradesh’s spending increased by 0.5% and MMR decreased 31%.


Assam, which spends 4.2% of its total expenditure on health and has 31.2 million people, has an MMR of 300 deaths per 100,000 births–comparable to Rwanda and Sudan–while Kerala, which spends 5.3% on 33.4 million, reported an MMR of 61, comparable to Sri Lanka and Poland.


Madhya Pradesh, which reported an infant mortality rate (IMR)–deaths per 1,000 live births–of 51 in 2015-16, spends 4.3% of total expenditure on healthcare–against 5% that was budgeted–and, as IndiaSpend reported on January 21, 2016, is worse off than some of the world’s poorest countries, such as the Gambia and Ethiopia.


Spending more on healthcare did not improve institutional births


In the nine “high-focus” states we studied, 72.6% of all births were in healthcare institutions, a steady improvement but below the national average of 78.9%, according to the 2015-16 National Family Health Survey (NFHS-4) data, the latest available.


Tamil Nadu with 72.1 million people spends 4.7% of its total budgeted expenditure on public healthcare and family welfare and reports 99% institutional births, while Jharkhand, with 33 million, spends 4% and reports 61.9% institutional births.


Uttar Pradesh (78), Madhya Pradesh (65), Chhattisgarh (64), Bihar (58) and Assam (56) report India’s highest under-five mortality rates–deaths per 1,000 live births–IndiaSpend reported on March 20, 2017.


Odisha reported an 118% increase in institutional births over 10 years, but the IMR declined by no more than 63% over this period.


The poor health indicators can be attributed to the lack of healthcare infrastructure and human resources in these states.


Not enough doctors and healthcare institutions


Bihar is 81% short of community health centres (CHCs), which provide secondary healthcare in the form of referrals and specialists to rural areas, and Jharkhand is 66% short of primary healthcare centres (PHCs), the first point of access to a qualified public-sector doctor in rural areas, according to the RBI report.


There is a 13% shortfall of CHCs in the “high-focus” states, according to India’s Health Management Information System.


Bihar was 93% short of specialists in CHCs, while the comparable figures were 90%, 84% and 84% in Chhattisgarh, Uttar Pradesh and Jharkhand, respectively, in March 2016, according to Accountability Initiative budget brief on National Health Mission.


The infrastructure shortage is made worse by the fact that in all the nine states, healthcare programmes are accessed by richer households while many poor households are excluded due to high direct and indirect costs, according to this 2012 study in PLOS-ONE, an online open-access scientific journal.


Such infrastructure shortages exacerbate inadequate spending and deliver low heath achievements. Increased primary healthcare spending reduces child and infant mortality rates, according to this 1999 research paper by the International Monetary Fund.


Promoting community-based education on improved maternal and newborn care, and home-based treatment for newborn infections could enhance child survival in the “high- focus” states “significantly”, said the 2012 PLOS-ONE study.


Correction: An earlier version of this story erroneously said that the maternal mortality of Assam was comparable to that of Zambia and Thailand. We regret the error.


(Rao is an intern with IndiaSpend.)


We welcome feedback. Please write to respond@indiaspend.org. We reserve the right to edit responses for language and grammar.

 
__________________________________________________________________


“Liked this story? Indiaspend.org is a non-profit, and we depend on readers like you to drive our public-interest journalism efforts. Donate Rs 500; Rs 1,000, Rs 2,000.”


5 Reasons Why Israel Matters to India (And Modi)

$
0
0

India_Israel_620

Prime Minister of Israel, Benjamin Netanyahu meeting Prime Minister, Narendra Modi, in New York on September 28, 2014.


Defence, agriculture, trade, diplomacy and water management will dominate talks when Prime Minister Narendra Modi visits Israel from July 4-6 at the invitation of Israeli Prime Minister Benjamin Netanyahu, the first Indian Prime Minister to visit the Jewish homeland.


Modi is also expected to meet Moshe Holtzberg, a survivor of the 2008 Mumbai 26/11 terrorist attack. Moshe was two years old when the attack happened.


“Ahead of the visit, both countries have prepared a roadmap of joint economic undertakings,” The Haaretz reported on June 29, 2017. “The Israeli cabinet approved a 23-page document continuing scores of bilateral measures and a budget of 280 million shekels (about $79.6 million or Rs 514 crore)–a bigger sum than Israel has ever set aside for China, Africa and Latin America combined. No fewer than 11 ministries were involved in preparing the program.”


Here are five things that define the India-Israel relationship today:


1) Defence: India is Israel’s top destination for arms exports, buying 41% of Israel’s arms export between 2012 and 2016, according to the Stockholm International Peace Research Institute, an independent global conflict and arms-research institute.


Israel is India’s third-largest source of arms, with a 7.2% share of imports between 2012 and 2016, next to the USA (14%) and Russia (68%).


India-Israel Defence Trade

Source: SIPRI Arms Transfers Database


India-Israel Defence Contracts
2013-14 2014-15 2015-16
Contracts Value Contracts Value Contracts Value
5 Rs 3751 crore
(US $650 million)
1 Rs 875.49 crore
(US $143.5 million)
4 Rs 2979.26 crore
(US $458 million)

Source: Lok Sabha


The earliest signs of collaboration came during the 1962 Sino-Indian war, when Israel provided India military aid.  Israel also assisted India during two wars with Pakistan in 1965 and 1971, according to this 2009 article in the Stanford Journal of International Relations.

India reciprocated during the six-day war in 1967 by providing Israel with spare parts for French-made Mystere and Ouragan aircraft as well as AX-13 tanks (also French-made), the Stanford report said.


The highlight of the partnership was Israel’s supply of artillery shells during the Kargil war in 1999 when India faced a shortage.


In the late 1990s, a crucial defence deal was the Indian purchase of Barak 1, an air-defence missile, bought specifically for its capability to intercept US-made Harpoon missiles deployed by Pakistan.


India’s imports of unarmed vehicles (UAVs) have almost all been from Israel. Of 176 UAVs purchased from Israel, 108 are Searcher UAVs and 68 are Heron UAVs, IndiaSpend reported in May 2015.


In April 2017, India and Israel signed a $2 billion (Rs 12,878 crore) deal for advanced medium-range surface-to-air missile system, which will provide the Indian army the capability to shoot down aircraft, missiles and drones at ranges of up to 70 km.


In September 2016, tests were conducted of the jointly developed Long Range Surface-to-Air Missile with a range of 70 km, intended to equip three guided-missile destroyers of the Indian Navy.


India successfully tested the Israeli-made SPYDER quick-reaction surface-to-air missile in May this year. The Indian Air Force is planning to deploy this system on its western border, India Today reported on February 28, 2017.


India and Israel also closely cooperate on counter-terrorism issues through a joint working group on counter-terrorism.


2) Diplomacy: Several ministerial and high-level official visits to Israel precede Modi’s tour. These include visits by LK Advani, former home minister, in 2000, former President APJ Abdul Kalam in February 2008, home minister Rajnath Singh in November 2014, President Pranab Mukherjee in October 2015 and external affairs minister Sushma Swaraj in January 2016.


Three Indian naval ships, destroyer INS Mumbai, frigate INS Trishul and tanker INS Aditya, made a goodwill visit at the Haifa port in May 2017 to mark 25 years of full diplomatic relations between the two countries.


Source: Embassy of India in Israel /Embassy of Israel in India


3) Agriculture: An Indo-Israel agriculture action plan for 2015-18 is operational, and 15 of the proposed 26 centers of excellence in agriculture are being developed in India with Israel’s help to showcase the latest technology to Indian farmers.


Phase-I (2010-12) and phase-II (2012-15) of the agreement are complete, according to this reply to the Lok Sabha (lower house of Parliament) on February 7, 2017.


Source: Embassy Of Israel In India


India has benefited from Israeli technologies in horticulture mechanisation, protected cultivation, orchard and canopy management, nursery management, micro-irrigation and post-harvest management, particularly in Haryana and Maharashtra.


Every year, more than 20,000 farmers visit the Agricultural Centre of Excellence at Gharaunda in Karnal, Haryana, where a nursery produces hybrid seedlings–including tomatoes, cherry-tomato, colored capsicum, cucumbers, eggplant and chilli pepper–grown in small, individual cells, ready to be transplanted into containers or a field.


There was a five-to 10-fold increase in crop yields with an accompanying 65% reduction in use of water and noticeable decrease in the use of pesticides and fertilisers, according to this December 2014 report on the Indo-Israel Agriculture Project.


Source: Indo-Israel Agriculture Project


4) Water Management: On June 28, 2017, the union cabinet approved a memorandum of understanding (MoU) with Israel on the National Campaign for Water Conservation in India.
Technologically-adept Israel has developed water-management technologies, located as it is in a semi-arid region with limited sources of fresh drinking water.


India and Israel had earlier signed an MoU on water resources management and development cooperation in November 2016.


5) Trade: Israel was India’s 38th largest trading partner, with trade of $5.02 billion (Rs 33,634 crore) in 2016-17, down 18% over 2012-13. The trade balance stood in India’s favour at $1.10 billion (Rs 7,370 crore) in 2016-17.


Source: Ministry of Commerce; Figures in $ billion


Mineral fuels and oils are India’s leading export to Israel, worth $1.01 billion in 2016-17.


India’s major imports from Israel in 2016-17 included natural or cultured pearls and precious stones, worth $1.11 billion.


Trade in diamonds accounts for nearly 54% of the bilateral trade. Nearly 40 diamond dealers from India have opened offices at the Israeli diamond exchange in Ramat-Gan. Some of these dealers have been active in Israel for nearly 30-40 years.


Israeli exporters complain about the difficulties in doing business in India “because of its onerous regulations, corruption and the division of the country into multiple jurisdictions of 29 states each with their own policies and rules”, the Haaretz reported.


The Israeli government has proposed measures such as “offering export insurance, liberalising the aviation sector and granting longer-term visas”. The aim is to boost Israeli exports to India by 25% over the next four years and tourists to 80,000 annually.


“Relations with Israel are significant for India because of cooperation in agriculture, defence and science/technology,” Uttara Sahasrabuddhe,  professor of international relations at the University of Mumbai, told IndiaSpend.


“Israel has been giving key weapons systems to India including missiles; it has given us those weapons which we could not directly buy from the US for ideological reasons; cooperation in counter-terrorism from information sharing to techniques/doctrine of counter terrorism,” Sahasrabudde said. “It is also an important source of foreign investment, if tapped with care. The visit of the Indian PM will indicate that New Delhi has come out of the old mindset.”


Modi’s visit is of “unprecedented importance with bilateral ties going through changing paradigm and changed architecture,” Israeli Ambassador to India Daniel Carmon was quoted as saying in the Economic Times on  June 28, 2017. “… there is no zero sum game and commitments and good relations with both sides can be maintained without contradiction.”


Modi will be received by his Israeli counterpart at the airport along with a “top protocol team” comprising Israelis from various fields including rabbis. This is a special gesture only accorded to the Pope or the US President, the Ambassador said.


The announcement has generated excitement among Israelis. The Israeli Embassy in India has tweeted a video where Israelis welcome the Indian Prime Minister in Hindi.


An estimated 85,000 Jews of Indian-origin live in Israel, the majority being from Maharashtra (Bene Israelis), with some from Kerala (Cochini Jews) and Kolkata (Baghdadi Jews).


While India recognised Israel on September 17, 1950–a year after it voted against United Nations’ membership for the Jewish state–full diplomatic ties were established only in 1992, the reticence flowing from India’s traditional backing for the Palestinian cause.


Since then, relationships have been defined by defence deals and the 35,000 mostly young Israelis who visit India each year to de-stress after their compulsory two-three years of military service.


The traffic isn’t all one-way: As many as 44,672 Indian tourists visited Israel in 2016, a 13% increase over the previous year, Financial Express reported on April 24, 2017.


(Mallapur is an analyst with IndiaSpend.)


We welcome feedback. Please write to respond@indiaspend.org. We reserve the right to edit responses for language and grammar.

 
__________________________________________________________________
 

“Liked this story? Indiaspend.org is a non-profit, and we depend on readers like you to drive our public-interest journalism efforts. Donate Rs 500; Rs 1,000, Rs 2,000.”


Why India’s Most Productive City Is Losing The Battle Against Child Malnutrition

$
0
0

mumbai_620

Mumbai’s skyline from Marine Drive which falls in Colaba Ward that has third highest malnutrition among children studying in Municipal schools.


Mumbai’s Colaba is well known for its art deco buildings, the Gateway of India, swish pubs and restaurants, and the pleasant promenade of Marine Drive. It houses the state assembly, Vidhan Bhavan, and the state secretariat, Mantralaya.


However, this high-profile ward recorded the third highest incidence of malnourishment (69%) among government school children in Mumbai in 2015-16, according to a report by the non-profit Praja Foundation, which IndiaSpend wrote about in this June 1, 2017, story.


Praja also found that malnutrition has increased four-fold among children in Mumbai’s municipal schools, from 8% in 2013-14 to 34% in 2015-16, even as a large portion of the budget for the mid-day meal programme has been left unutilized.


How can such a dire situation exist in the city that generates more money than any other in India, ranking 17th among the 20 richest cities of the world? In this two-part series, IndiaSpend seeks to answer this question. This story takes a deep dive into the data and also visits some of Mumbai’s poorest localities to explore the extent of the problem.


The next part will examine the unique challenges that the urban poor face, focusing on how children, in particular, suffer, and exploring the interventions that can help.


Highrises and slums


Slums are not easy to spot in Colaba, where real estate prices go up to Rs 1,00,000 per square foot. However, towards the tapering edge of the island city, bordering the defence forces’ area of Navy Nagar, lies Geeta Nagar. Between the ramshackle houses, one can glimpse the sea, and the high tide brings seawater into people’s homes.


The Geeta Nagar settlement came up in the 1960s when workers building the Tata Institute of Fundamental Research settled here. With a population of 6,000 today, it is not as populated and deficient in resources as other informal slum settlements in Mumbai.


GN_Lane

Left to right: Houses at Geeta Nagar and boundary wall separating Navy colony from Geeta Nagar.


“Most of the community here is of migrants from Maharashtra and Uttar Pradesh. Most mothers work as domestic help in homes nearby and fathers work as security men or drivers,” Velankani Joseph, a social worker who lives here and works for the Fourth Jesus and Mother Convent, a school,  told IndiaSpend. “Since mothers can cook only one meal [at home] in a day, the kids here eat biscuits, chips and fried snacks between meals.”


As many as 49% boys and 59% girls were malnourished in Colaba Ward, in which Geeta Nagar lies, in 2015-16, according the Praja Foundation report cited above. The total number of malnourished children rose from 244 in 2014-15 to 2,768 in 2015-16, the report found.


Malnourishment in government-run schools has risen four-fold


The Mumbai civic body, Brihanmumbai Municipal Corporation (BMC), conducts a yearly health assessment of all children studying in its schools. Praja accessed this data through Right to Information filings, and concluded from analyzing this data that younger children were more likely to be malnourished–73% of malnourished children in 2015-16 studied between grades I to V.


Malnutrition In Indian Cities


Source: National Family Health Survey-4


Mumbai’s high malnutrition figures are despite the fact that 83% of government and aided schools in Mumbai city and and 95.1% in its suburbs, respectively, have a mid-day meal programme, according to the District Information System for Education (DISE).


The BMC, the richest municipal corporation in the country, denies Praja’s contention that malnutrition has increased four-fold. “There has been a misunderstanding by Praja Foundation. Before 2014, we only measured weight for age. Since 2014, we also measure height, weight for age and also waist circumference,” Padmaja Keskar, executive health officer, BMC, told IndiaSpend. “Also, underweight does not mean malnourished.”


Praja Foundation terms these “excuses,” emphasizing that the BMC should be trying to find solutions instead. “If the BMC had not been measuring height along with weight of the child before 2014, it is a gross negligence on their part because even a basic body mass index, requires height measurement” said Milind Mhaske, Project coordinator, Praja Foundation.


Even accounting for the BMC’s argument about change of methodology of assessment after 2014, the data shows that 36% of children studying in BMC schools are malnourished.


Mhaske says this points to failure of the integrated child development scheme, which seeks to provide nutrition and pre-school education to children under six; the public distribution system of the central government which aims to make available food and non-food items to the poor; and the mid-day meal programme run by respective state governments to provide free meals to primary and upper primary school children.


The World Health Organisation considers malnourishment to cover two kinds of conditions: under-nutrition which leads to stunting (low height for age), wasting (low weight for height), low weight (for age), and micronutrient deficiencies on the one hand, and obesity and related problems on the other.


Being underweight is a symptom of malnourishment, Dr Alka Jadhav, head of pediatrics at Lokmanya Tilak General Municipal Hospital, Mumbai, told IndiaSpend: “It means the child is undernourished and not getting the nutrition he or she needs.”


Government data has also shown up worrying statistics pertaining to childhood malnutrition.


Among children under the age of five, 21.3% are stunted, 20.3% wasted, and a total of 28.9% children are underweight, according to the National Family Health Survey-4 (2015-16) for Mumbai Suburban, which has thrice the size and population of Mumbai city and extends up to Dahisar in the north and Mulund in the east.


NFHS-4 numbers are worse for Mumbai city (which consists of South Bombay from Colaba to Sion and is also known as the Island City), with one among four children under five years of age being stunted (25.5%), wasted (25.8%) and underweight (22.7%).


Further, the survey notes, between the age of six months and two years, the percentage of children getting adequate nutrition is 14.2 % in Mumbai suburban and 6.4% in Mumbai city.


Inequity of access and outcomes


Mumbai’s glittering skyline hides inequities that impact people’s access to healthcare, sanitation and government services. Nowhere is this more visible in Mumbai’s slums, where 41.3% of its population lives.


Nearly 60% of Mumbai’s slum population lives on 8% of land in the city, jostling not just for space but also basic facilities–fewer slum households have access to a drinking water source within the premises than other urban areas (56.7%, as against 71.2%), a bathroom (66.6% as against 77.5%), covered drainage (36.9% as against 44.5%), clean cooking fuel such as LPG (51.3% as against 65%) or a latrine (66% as against 81.4%), according to the 2015 Save the Children report “Forgotten Voices: The World of Urban Children in India.”


Mumbai’s problem is emblematic of the challenge facing the entire country in the years to come–over the next five years, India’s urban population is projected to double to more than 800 million, of which about 200 million are likely to live in poverty, IndiaSpend reported in June 2015.


Yet, the Indian government allocates to its urban citizens only one-sixth the per capita spending allocated for rural citizens and one-tenth of what is allocated for the rural poor.


“The urban health system is still evolving, there is an urgent need for decentralization of health services and in its current state perhaps it [urban health system] is not at par with this increasing demand of health care among the urban poor,” Suvarna Ghosh Jerath, Additional Professor, Public Health Foundation of India, Delhi, told IndiaSpend. “Perhaps due to their low visibility among general urban population, the magnitude of the problems of the urban poor isn’t well known.”


(In the next part of this series, we visit Govandi, the ward with worst malnutrition figures in Mumbai, to explore the unique problems facing the urban poor and the interventions that are likely to work.)


(Yadavar is principal correspondent with IndiaSpend.)


We welcome feedback. Please write to respond@indiaspend.org. We reserve the right to edit responses for language and grammar.

 
__________________________________________________________________
 

“Liked this story? Indiaspend.org is a non-profit, and we depend on readers like you to drive our public-interest journalism efforts. Donate Rs 500; Rs 1,000, Rs 2,000.”


India Less Violent Than 2016, But Less Peaceful Than Decade Ago

$
0
0

peace_620


Reduction in violent crimes and increased law enforcement saw India improve its peace ranking by four positions from 2016, but it is less peaceful than it was a decade ago, according to the 2017 Global Peace Index (GPI), released by the Institute for Economics and Peace, a New York-based think tank that develops metrics to analyse peace.


India’s 2017 rank was 137 of 163 countries, moving up four positions from 141 in 2016. However, deaths due to external conflict have increased, the report said, specifically in relation to the conflict in Kashmir from mid-2016.


India is less peaceful than it was a decade ago, and it suffers from more violence than Brazil and South Africa, both countries wracked by violence.


A decade ago, India had a GPI score of 2.437. Lower the score, the more peaceful a country: Iceland, the most peaceful country, had a GPI of 1.111 in 2017. India’s GPI score in 2017 was 2.541 (out of 5), an improvement from 2.565 last year.


The peace index is based on 23 indicators related to level of safety and security in society, the extent of domestic or international conflict, and the degree of militarisation.


The world has become slightly more peaceful in 2017, with an average 0.28% improvement in “peacefulness” since 2016.


Source: Global Peace Index 2017


Among BRICS countries, India is ranked below Brazil (116), China (123) and South Africa (123) but higher than Russia (151).


Among its South Asian neighbours, India is ranked below Bhutan (13), Sri Lanka (80) Bangladesh (84) and Nepal (93) but ahead of Pakistan (152) and Afghanistan (162).


The economic cost of violence


The economic cost of violence in India in 2016 was $742 billion (Rs 47.5 lakh crore) at 2016 purchase power parity (PPP) rate. This accounts for 8.6% of India’s gross domestic product (GDP) and $566 (Rs 36,500) per capita.


The per capita economic cost of violence in India is 8.7% higher than China ($517) which lost $712 billion or 3.5% of GDP due to violence in 2016.


The global economic impact of violence was $14.3 trillion in 2016, equivalent to 12.6% of GDP, or $1,953 (Rs 125,000) per person.


“Every $1 invested in peace-building can lead to $16 decline in the cost of armed conflict,” the GPI report said.


Among BRICS countries, India’s per capita economic cost of violence is about a fifth of South Africa’s ($2,582), a seventh of Russia’s ($3,608) and a fourth of Brazil’s ($1,952).


Among South Asian countries, India’s per capita economic cost of violence is 12% lower than Pakistan ($634), 45% lower than Sri Lanka ($823) and 68% lower than Afghanistan ($949).


Source: Global Peace Index 2017


India is 70th of 163 countries ranked on the basis of economic cost of violence as a percentage of GDP.


Civil war-hit Syria, which lost 67% of its GDP to violence, is ranked as the world’s most violent nation, followed by conflict-ridden Iraq (58%) and Afghanistan (52%). Switzerland is ranked 163.


Ten-year trend: Terrorism has worsened things in Pakistan and the world


India’s score in the terrorism impact index improved marginally by 0.006 points, from 4.013 in 2008 to 4.007 in 2017.


Source: Global Peace Index


The terrorism impact index calculation is based on a weighted average of the last five years of the number of fatalities, injuries and property damage caused by terrorism.


The impact of terrorism in Pakistan has worsened with the score increasing by 0.279 points from 4.089 in 2008 to 4.368 in 2017.


“The impact of terrorism increased dramatically over the last decade with the scores of 60% countries deteriorating,” the report said.


In over 22 countries, terrorism impact index scores have deteriorated by more than 100% while the score worsened by more than 50% in another 18 countries.


Deaths due to terrorism around the world have nearly tripled from just over 11,000 in 2007 to 29,000 in 2015.


“Deaths from terrorism in OECD countries increased over 900% between 2007 and 2016, with the largest increases occurring in Turkey, France, the United States, and Belgium,” the report said.


Europe, in particular, has seen a spate of deadly attacks in recent years.


(Sethi is a Mumbai-based freelance writer and defence analyst.)


We welcome feedback. Please write to respond@indiaspend.org. We reserve the right to edit responses for language and grammar.

 
__________________________________________________________________
 

“Liked this story? Indiaspend.org is a non-profit, and we depend on readers like you to drive our public-interest journalism efforts. Donate Rs 500; Rs 1,000, Rs 2,000.”


Indians Killed Due To Climate Change In 2012 = Population Of Lucknow

$
0
0

climate_620


The March 2016 report titled Preventing disease through healthy environments analysed the impact of environmental hazards and risks of climate change on global health across 194 countries.


These deaths–avoidable if governments and citizens adopted sustainable environmental practices–accounted for 30% of all deaths in India that year. In comparison, 25% and 23% deaths, in Pakistan and Bangladesh, respectively, were attributable to the environment, according to the Global Health Observatory (GHO) data. As many as 23% of global deaths (12.6 million) and 26% of deaths among children under five that year were due to modifiable environmental factors, the report said.


Of the 2.9 million deaths in India in 2012, 1.7 million were caused by non-communicable diseases such as heart disease and cancer.


Globally, 31% of cardiovascular diseases are caused by household and ambient air pollution, second hand tobacco smoke and prevalent chemicals in the environment. Of the 49 million disability-adjusted life years (DALYs) lost due to cancer globally, 20% were due to air pollution, mismanagement of chemicals, ultraviolet radiation etc, according to GHO data. The DALY is a measure of overall disease burden, expressed as the sum of years of lives lost due to dying early and years lost due to disability.


As many as 57% of diarrhoeal diseases are caused by poor water, sanitation, hygiene and agricultural practices, due to climate change, according to the WHO report.


In seven years, natural disasters killed more than 15,000 Indians, damaged 6.7 mn homes


Changes in climate not only cause diseases, but also cause extreme temperatures, increasing the likelihood of weather-related natural disasters such as storms, floods and droughts. Since April 2010, water- and earth-based natural calamities caused 15,287 deaths in India, according to an IndiaSpend analysis of government data (here and here). Besides the loss of life, livelihoods were also destroyed with 6.7 million houses damaged and 360,000 cattle heads lost.


Source: Ministry of Statistics and Programme Implementation Page 254- 256; Table 3.8.2, Lok Sabha

NOTE: *Provisional; Natural calamities include cyclonic storms, heavy rains, floods, landslides, etc.


Between 2012-13 and 2013-14, there was a nearly five-fold increase in the number of lives lost due to natural disasters.


Of the 5,845 lives lost in 2013, 61% were due to the 2013 Uttarakhand floods. Two main events led to the devastation in the Kedarnath area, according to this 2015 report by the National Institute for Disaster Management. On June 16, 2013, torrential downpour led to active soil erosion near the Kedarnath region. As a result, huge volumes of water studded with debris hit the town, causing massive destruction to 10,625 livelihoods, the report said. This debris collection was caused mainly by the “accelerated depreciation of the environment due to the construction of roads, buildings, hydro-electricity projects, sand and stone collection from river channels, unchecked deforestation etc”.


The second event, which occurred the next day, was caused by the breach of the Chobari Lake, releasing massive flood waters causing more devastating damage in the area.


The Bihar floods in 2016 claimed 243 lives which was the national highest that year–despite receiving 14% lesser rainfall than expected. “India’s poor water management policy seems to be at fault,” according to this August 2016 report by Scroll. “The country’s dependence on large dams, built without environmental checks and balances has upset the Gangetic water system enough to have caused this widespread, unusual flooding.”


Source: Lok Sabha

NOTE: Data for Chandigarh, Delhi, Goa, Manipur, Mizoram, Puducherry, Andaman & Nicobar, Lakshyadweep, Daman & Diu and Dadra & Nagar Haveli are not available; Natural calamities include cyclonic storms, heavy rains, floods, landslides, etc. Data as on February 22, 2017


As many as 117 countries and territories (54%) were hit by disasters in 2015, according to this October 2016 report by the Centre for Research on the Epidemiology of Disasters (CRED), a Brussels-based non-profit and a WHO collaborating centre as part of the Global Program for Emergency Preparedness and Response.


There was a 14% increase in the number of reported natural disasters in 2015 (376) compared to 2014 (330). The number of climatological disasters (45)–which include droughts, wildfires, extreme temperatures–was the highest since 2005, according to the CRED report.


Update: The story has been updated to say that changes in climate increase the likelihood of weather-related natural disasters.


(Abraham is an intern with IndiaSpend.)


We welcome feedback. Please write to respond@indiaspend.org. We reserve the right to edit responses for language and grammar.

 
__________________________________________________________________
 

“Liked this story? Indiaspend.org is a non-profit, and we depend on readers like you to drive our public-interest journalism efforts. Donate Rs 500; Rs 1,000, Rs 2,000.”


Mumbai’s ‘M East’: Where 50% Children Under 2 Years Are Stunted, 40% Underweight

$
0
0

malnourished_620

Nikhat Mohammed Humayun Sheth, 22, with her sons Mohammed Iman (2.5 years) and Mohammed Ayan (10 months) at Rafi Nagar Slum, Govandi, Mumbai. Mohammed Iman was born premature and was of low birth weight. He suffered from Severe Acute Malnutrition and was often hospitalised.


On the northern edge of the metropolis of Mumbai, lies another face of the city. Buildings give way to hutments, roads get narrower, and government services get scarcer as we reach the ‘M East’ municipal ward, called ‘M/E’ for short.


Known best for housing the 132-hectare Deonar dumping ground that grows by 4,500 tonnes of garbage every day, this ward includes Chembur East, Govandi, Mankhurd and Shivaji Nagar, covering 256-plus slums and 13 resettlement colonies.


This is the ward where 50% of children studying in municipal schools were found malnourished, more than anywhere else in the city, according to data from the civic body, the Brihanmumbai Municipal Corporation (BMC), accessed and published by the non-profit Praja Foundation, as IndiaSpend reported in June 2017.


In this second of our two-part series investigating malnutrition in Mumbai, we visited Govandi to explore how the urban poor face unique challenges; how children, in particular, suffer; and what interventions can help.


M/E ward


A marshy area adjoining the sea, this ward was once considered so inhospitable that the city’s planners intended to use it for refineries, fertiliser plants and an atomic energy plant.


govandi (1)


In the 1970s, the municipal corporation resettled many slum dwellers to Shivaji Nagar area from the main city. Later, original residents of the area where the atomic energy plant came up were also resettled here.


As Mumbai city grew, Bandra’s abattoir and Dharavi’s dumping ground were also moved to this ward. Today, it is home to 800,000 people, 77% of them living in slums. It recorded the lowest human development index in the city at 0.05, worse than many sub-saharan African countries.


Anatomy of a slum


Rafi Nagar is a bustling slum settlement neighbouring the Deonar dumping ground, which looks like a hillock and is as high as four storeys of nearby buildings. A few years ago, the main road was repaired and is now dotted with small shops. On either side are narrow lanes, each with a thin drain running down the middle, on either side of which lie tin huts squeezed together. Each one-room tenement–a kitchen, living space and bedroom rolled in one–faces another. There is little light indoors even during the day, but most houses have electricity and a television set, as well as an open bathing area inside.


IMG_9147

Typical slum settlement at Rafi Nagar, Govandi


Each lane is lined with bright blue cans placed outside each house, so as to make a quick dash when the water tanker arrives. Household activities are planned around the arrival of the tanker.


water

Left to right: An abandoned toilet complex at Lotus Colony, Govandi, Mumbai; bright blue cans are placed outside each house, so as to make a quick dash when the water tanker arrives.


Water is rationed, so bathing is not a priority. Public toilets are in a poor shape and most seem to have been abandoned due to lack of maintenance.


In 2011, families in Mumbai slums spent between 52 times and 206 times more on water than the standard municipal charge, and 95% of slum-dwelling families used less water than the World Health Organization’s (WHO’s) standard of 50 litres per person, according to this study published in the journal BMC Public Health.


Without safe drinking water and adequate sanitation, children often contract diarrhoea, the second-most common cause of death in children under five.


Meagre incomes, little food to go around


In the holy month of Ramazan and most women were sitting outside their homes embroidering skull caps. Younger children were tasked with sorting the beads or gluing them together.


children

Left to right: During the month of Ramazan, most of the households in the slum are working on embroidering skull caps, children also help out; children swim in the creek to beat the heat oblivious to the fact that drains open into the creek at Rafi Nagar, Govandi


Some children beat the muggy May heat by playing in the creek, into which dirty drain water empties out.


In one of the numerous crowded lanes of Rafi Nagar, we met 10-year-old Sadia Khan and her family. Sadia looked no older than eight, and studied in grade VI. Her mother, Nazbunissa Khan, 30, said Sadia was often sick with diarrhoea and complained of weakness.


IMG_9175

Sadia Khan, 10 and her brother Mohammed, 8, living in Rafi Nagar, Govandi are malnourished. Sadia doesn’t like to eat vegetables and fruits and her family cannot afford milk. Her brother says he doesn’t like the khichdi served for mid-day meal in school.


Like many children her age, Sadia did not care for fruits and vegetables but preferred snacks such as lahsun chivda (garlic-flavoured fried chickpea flour mix), “Chinese bhel” (made from noodles and schezwan sauce), aloo bhujia, Khan said.


Khan has three children, and previously lost two to tetanus and tuberculosis. She has no education and hails from Uttar Pradesh. Her husband, a zari worker (an embroiderer), is the only earning member.


Sadia’s family was typical of most families in M/E Ward. As many as 40% of the families here earned between Rs 5,000 and Rs 10,000 a month, 20% earned less than Rs 2,000, and, in all, 62% were not able to save anything, according to a 2015 study conducted by the Tata Institute of Social Studies (TISS), Govandi, and covered all households in the ward.


With such meagre earnings, 59% of the families could only afford two meals a day. Fewer than 10% were able to consume items such as milk, fish, meat, eggs and fruit on a daily basis. Most families bought milk but used it only for tea.


Low income had a direct impact on the quality and quantity of food available, and the results were dire: 45% of children under five in M/E ward were stunted and 35% were underweight. Nearly half the children under two were stunted and two-fifths underweight, as per the TISS study.


The illiteracy rate in the ward was 21%, twice that of Mumbai’s (11%); 30% of women here were illiterate, which was thrice the 9% rate among Mumbai’s women; and 90% of Muslim women living in the area did not work for a living.


On most days, Sadia’s family did not have enough to buy milk and the children do not carry tiffin (packed lunch) to school. When asked if her daughter ate the mid-day meal offered in municipal schools, Khan said she did not know.


“We don’t like the khichdi served,” said Sadia’s younger brother Mohammed, 8, who was also thin and frail.


Khan said the children ate a meal of rice and dal (curried lentils) on coming home from school.


Large families, more mouths to feed


Family planning is not a popular idea here due to religious and cultural inclinations and, often, women’s lack of decision-making power.


When asked if she had tried family planning, Khan said no: “I want to have five kids, maybe one more boy.”


Most women in M/E ward undergo 3.8 live births on average, of which 3.6 survive.


Education significantly impacted family size, and women with more than secondary education reported half the birth rate compared with women with no education, the TISS report noted.


“We have visited households where a mother has had 17 children. Our field officers have to work very hard convincing them about seeking family planning methods,” Sonali Patil, Associate Program Director with the Society for Nutrition, Education and Health Action (SNEHA) Centres, which works to curb malnutrition in children and promotes contraception among women, told IndiaSpend.


IMG_9180

Sonali Patil, Associate Program Director, Society for Nutrition, Education and Health Action (SNEHA) Centres Program which is working on malnutrition in children and anemia and contraception in reproductive women in the area.


Patil said 66% of women did not practice family planning when SNEHA carried out a baseline study in 2011 among 6,000 women in the reproductive age group in Govandi and Mankhurd. She said the figure had decreased to 59% in 2016, after SNEHA’s intervention.


Lack of education also posed a challenge to government-run immunisation programmes.


“It is not easy here, we organize immunisation camps but no one turns up,” a medical health officer who did not wish to be named, told IndiaSpend. “We have to spend an hour speaking to a mother to convince her to let her children get immunised.”


We visited Nikhat Mohammed Humayun Sheth in her Rafi Nagar house. Sheth looked barely 16 years old, but said she was 22. Her two-and-half-years-old toddler was playing outside and there was an infant rocking in an improvised hammock suspended from the ceiling.


Her older son, Mohammed Iman, crawled inside and started asking for his “powder”, a medical nutrition treatment (MNT) supplement made and distributed free-of-cost by the Nutrition Rehabilitation Centre in Dharavi.


Mohammed Iman was born premature at eight months, weighing only 1.7 kg. He was confined to an incubator during his first few days, and had constant health issues since, including jaundice and diarrhoea for which he had been hospitalised.


Baby brother Mohammed Ayan is 10-months-old, was born at full term and weighed 2.4 kg at birth. However, he was also admitted in Sion Hospital recently for pneumonia.


A baby weighing less than 2.5 kg at birth is termed ‘low birth weight’ irrespective of gestational age, according to the WHO. Both Mohammed Iman and Ayan were low birth weight babies.


Low birth weight infants are 40 times more likely to die within first four weeks of life than normal birth weight infants. Low birth weight is also linked to inhibited growth and cognitive development as well as chronic diseases later in life.


Nikhat said she is determined to keep her children healthy but struggled to manage expenses with the Rs 5,000 a month that her husband, a zari worker, earned.


Limited access to basic services


Many among the most vulnerable are unable to access government services.


The area has four health posts–primary health care centres that provide maternal and child care services–for a population of over 500,000, Sanjay Bamne, Deputy Programme Manager with the non-profit Apnalaya told us in his office in Shivaji Nagar. There are 21 anganwadis (creches) for a population of 42,000.


Bamne said it has taken years of advocacy to get health posts and anganwadis here. “The anganwadi workers do not use electronic weighing scales and measure only weight and not height, so they only measure whether a child is underweight and not stunting and wasting,” he said.


Non-profits such as Apnalaya have evolved their strategies from providing nutritional supplements to malnourished children to encouraging health-seeking behaviour among mothers and counselling them about nutrition.


“We help mothers create groups, which encourage members to deliver babies in hospitals, take their children for immunisation, and so on,” said Jagdevi Bansode, a field officer with Apnalaya who has been working here since the last 24 years, and now oversees four health workers. “We have been conducting cooking classes, giving women ideas on how to cook wholesome, nutritious meals for their children.”


IMG_9150

Jagdevi Bansode, field officer, Apnalaya, has been working in this slum for the last 24 years.


Since 2010, the Nutrition Rehabilitation Centre at the Urban Health Centre in Dharavi, known as ‘Chhota Sion Hospital’, has been treating malnutrition in urban areas in and around Mumbai.


Its nutritionists, doctors, nurses and counsellors as well as an in-patient facility attract malnourished children from as far as Thane (30 km away) and Palghar (100 km away).


It is here that the WHO-recommended MNT powder is made from peanut butter, soya, milk powder, powdered sugar and micronutrients. It is distributed for free to children with severe acute malnutrition (SAM).


“Children with severe acute malnutrition (SAM) are nine times more likely to die and those with moderate acute malnutrition (MAM) four times more likely to die of any causes than normal children,” Alka Jadhav, department head of paediatrics at Lokmanya Tilak Municipal General Hospital, Sion, who oversees the rehabilitation centre, told IndiaSpend.


The MNT powder is designed to encourage rapid weight gain. It takes six to eight months for an SAM child to reach the MAM stage. The centre has treated over 3,000 malnourished children so far.


Jadhav said it was more difficult to treat malnutrition in urban areas than in rural areas: “Living expenses in cities are far more and with changing aspirations like wanting cable TV and mobile phones, nutrition is just not a priority for most households.”


(Series concluded. You can read the first part here.)


(Yadavar is principal correspondent with IndiaSpend.)


We welcome feedback. Please write to respond@indiaspend.org. We reserve the right to edit responses for language and grammar.

 
__________________________________________________________________
 

“Liked this story? Indiaspend.org is a non-profit, and we depend on readers like you to drive our public-interest journalism efforts. Donate Rs 500; Rs 1,000, Rs 2,000.”


New Chinese Naval Deployments In Indian Ocean, Indian Navy Outgunned 1 To 4

$
0
0

warship_620


China’s People’s Liberation Army Navy (PLA-N) has 283 major surface combatant warships, four times more than those under the control of the Indian Navy (66), according to an IndiaSpend analysis of publicly available data.


Source: US Office of Naval Intelligence, Indian Navy


China’s widening naval capabilities compared to India can be seen in the context of the PLA-N’s growing presence in the Indian Ocean region.


“Chinese activity in the Indian Ocean has touched a new high in recent months,” according to an Indian Navy official, The Hindustan Times reported on July 5, 2017.


The Indian Navy has sighted over a dozen PLA-N warships, submarines and intelligence-gathering vessels in the Indian Ocean in the last few months.


These sightings come as the Indian and Chinese troops are locked in a three-week long standoff at the India-China-Bhutan tri-junction near Sikkim, leading to increasingly belligerent rhetoric between New Delhi and Beijing.


Comparing inventories


The PLA-N has 26 destroyers, more than twice as many as India (11). Destroyers are both the PLA-N and IN’s frontline warships that possess powerful radars, can travel long distances and are capable of fulfilling land attack, missile defence, and surface and anti-submarine warfare. This makes them very powerful tools for power projection.


China recently launched its indigenously developed 12,000-tonne Type 55 destroyer, which “is considerably larger and more powerful than India’s latest … destroyers which have still not been commissioned”, according to NDTV Defence Editor Vishnu Som.


China’s Type-55 will eventually have around 120 missiles of various types. India’s most powerful destroyer, the yet-to-be commissioned Project 15-B “Visakhapatnam” class destroyers, will have 50 missiles.


The PLA-N has 52 frigates, nearly four times as many as India (14). Frigates are not as heavily armed as destroyers but can fulfil similar roles and can operate in open oceans.


India has 25 corvettes and missile boats, around one-fourth as many as China (106). Corvettes and missile boats are lightly armed as compared to frigates and provide coastal protection.


India’s aircraft carrier advantage no more?


So far, both India and China each have one aircraft carrier. The carrier is a sign of its growing military prowess.


In April 2017, China launched a new aircraft carrier, its second after the Liaoning, but the first to be indigenously manufactured. The Chinese aircraft carrier is scheduled to be operational by 2020.


The development comes as India’s own homemade aircraft carrier, INS Vikrant, faces several delays. The Vikrant has been in development since 2009 but is unlikely to be completed before 2023, The Hindu reported on July 28, 2016.


For decades, India has enjoyed a naval advantage over China by possessing at least one aircraft carrier in its inventory while the PLAN had none.


China now possesses the Liaoning, a Soviet-era warship it purchased from Ukraine and commissioned in 2012 following refit. After four years of testing, the Liaoning conducted its first ever live-fire drills on December 16, 2016. It also conducted similar drills in the disputed South China Sea on January 3, 2017, a sign of its increasingly aggressive posture.


The Liaoning was getting ready to expand its operations to other regions, including the Indian Ocean, a Chinese naval expert told the Chinese government-owned newspaper Global Times in December 2016.


“Ultimately, Beijing will likely build at least a half-dozen carriers to meet its requirements,” wrote defence expert Dave Majumdar in the National Interest, an international affairs publication, on February 22, 2017.


The Indian Navy has finalised the specifications for the construction of INS Vishal, an indigenous successor to INS Vikrant. The Vishal will be nuclear-powered, weigh 65,000-tonne and carry more aircraft than Vikrant and Vikramaditya. India is collaborating with the US to fit it with advanced “electro-magnetic aircraft launch system” (EMALS) for the aircraft.


Maritime doctrine


Indian Navy’s force structure is aimed at providing it with the capability to project power in ‘blue waters’ as envisioned in the Navy’s revised 2015 maritime doctrine.


“In theory, a blue-water Navy is a maritime force capable of operating in the deep waters of the open oceans,” noted  Abhijit Singh, a Senior Fellow and Head, Maritime Policy Initiative at Observer Research Foundation, in The Diplomat, a current-affairs magazine.


The navy’s doctrine defines India’s areas of maritime interest as the wider Indian Ocean, which includes the Arabian Sea, Bay of Bengal, Andaman Sea, South-West Indian Ocean, Persian Gulf, Gulf of Oman, Gulf of Aden, Red Sea and chokepoints such as the Strait of Hormuz.


The PLA-N’s growing area of operations in this region places it in direct competition to India’s defined interests. However, it’s important to note that the PLA-N and its current force structure is aimed at securing the South China Sea and East China Sea, which it claims as its territories and is embattled in a bitter dispute with neighbouring countries as well as the US.


(Sethi is a Mumbai-based freelance writer and defence analyst.)


We welcome feedback. Please write to respond@indiaspend.org. We reserve the right to edit responses for language and grammar.

 
__________________________________________________________________
 

“Liked this story? Indiaspend.org is a non-profit, and we depend on readers like you to drive our public-interest journalism efforts. Donate Rs 500; Rs 1,000, Rs 2,000.”


India’s Wildlife Crisis, And Why Hope Is So Important

$
0
0

forest_620


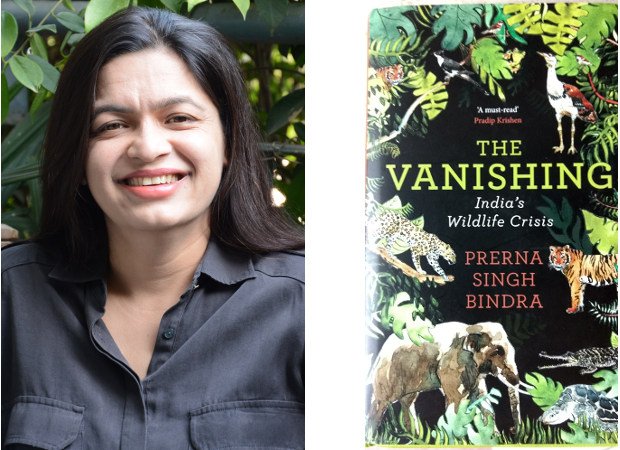
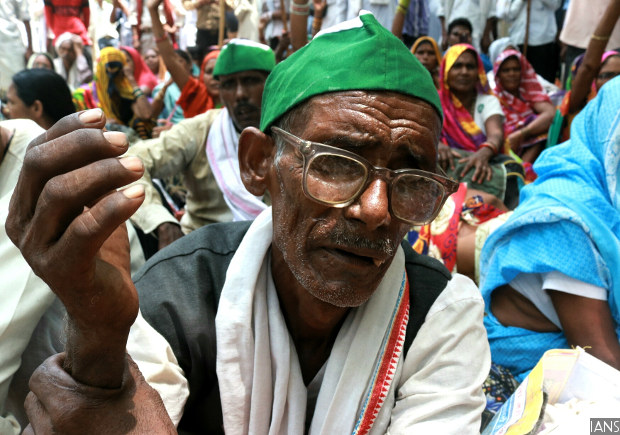
“A great silence is spreading over the natural world even as the sound of man is becoming deafening,” Prerna Singh Bindra, 45, a wildlife journalist, quotes Bernie Krause, who recorded the sounds of over 15,000 species, as she writes about the constant threat to India’s wildlife in her book The Vanishing: India’s Wildlife Crisis.


PBS

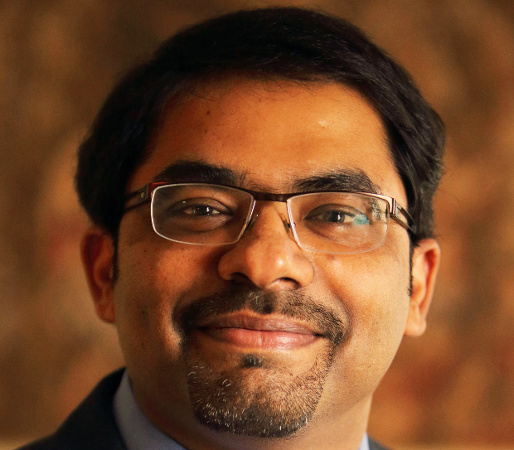
Left to right: Wildlife journalist Prerna Singh Bindra; front cover of her book ‘The Vanishing: India’s Wildlife Crisis’


India, a biodiversity rich country, has just 2.4% of the world’s geographical area but accounts for 11.4% of the world’s plants (about 48,000 species), and 7.5% of its animals (about 96,000 species), according to government data.


But with habitat destruction and poaching, 25 species of animals and 77 plant species are critically endangered, 205 animals and 172 plants are endangered, while 385 animals and 138 plants are vulnerable, according to the International Union for Conservation of Nature.


In India, we continue to clear no less than 135 hectares of forest–equivalent to 189 soccer fields–a day, diverting it for various projects such as highways, mines and cement factories, even as India’s forests neutralise 11% of India’s total greenhouse gas emissions at 1994 levels–equivalent to offsetting 100% emissions from energy use in residences and transport, Bindra writes in her book.


But India still has incredible biodiversity–the maximum numbers of tigers and asiatic elephant in the world, 90% of the gharial population, the only place with the Great Indian Bustard and Lion-Tailed Macaque, Bindra told IndiaSpend over phone, from the the Tilari forests in the western ghats, as a herd of elephants came in. “The book is about hope not despair. This is a rallying call–we can save this beautiful world if we start now.”


reading_forest

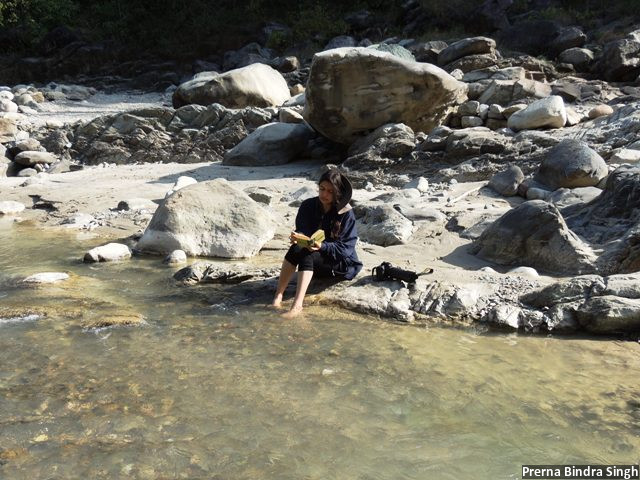
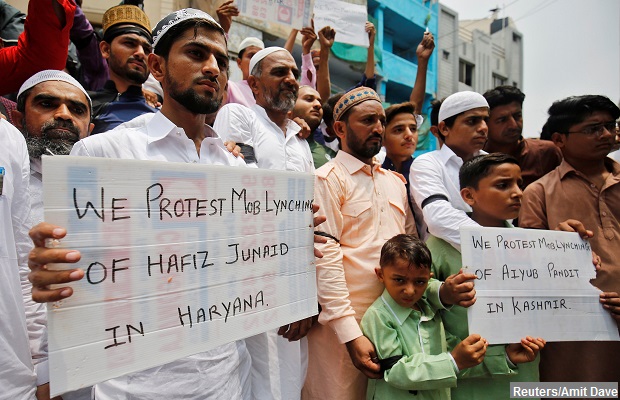
“I live in Gurgaon but my heart resides in the forest” – Prerna Singh Bindra


Bindra has widely travelled across India to explore its wilderness, served as a member of India’s National Board for Wildlife and its core Standing Committee, and on Uttarakhand’s State Board for Wildlife. She started off studying management but soon realised that her passion lay elsewhere. Over the last 15 years, she has written several articles on the environment, is the author of the book The King and I: Travels in Tigerland, and of a children’s book When I grow up I want to be a tiger. She loves books, dogs and cooking but isn’t a great cook, she said. I live in Gurgaon but my heart resides in the forest, she said.


With personal stories of missing school work for the hatching of a peahen’s eggs, to moments with tigers, gharials, and the Indian bustard, to trying moments as part of India’s National Board for Wildlife, in her latest book Bindra writes about both India’s successes in and apathy to wildlife conservation.


IndiaSpend spoke to Bindra about the state of India’s wildlife, challenges in wildlife conservation, and the way forward for ecological sustainability. Edited excerpts.


Q: The book paints a bleak picture of the state of conservation in India. According to you, what are the major causes of this endangerment?  


Firstly, yes, the subject is bleak. I would like to make it clear, though, that the book is not about despair, it is about hope. Ignoring the crisis is not the answer–burying our head in the sand only means we dig ourselves in deeper. The idea is to empower, to hopefully shake people up, to get a dialogue going. India has this incredible wealth of wildlife, but its current status is precarious, and this is why it matters to us.


One key cause of endangerment is poaching, which is ruthlessly exterminating wildlife. It is not just tigers or leopards. The market is driving many species to the brink—from turtles (for meat) to beetles (for private collections) to owls (used in black magic). The pangolin, an elusive, nocturnal animal also called the ‘scaly anteater’, is being trapped, snared, killed by the thousands to meet a demand for its meat and scales for international markets in Far East and Southeast Asia. The pangolin is the hottest ‘item’ in the market today, and driving it to extinction.


The problem is we haven’t taken the gravity of this crime on board–illegal wildlife trade is a multi-billion dollar industry, and is linked to terrorism and arms smuggling. We are woefully unequipped to deal with an organised crime of this scale–on average, there is a 30% shortage of frontline forest; in some reserves like Palamu in Jharkhand, it is well over 90%! The agency to deal with it–the Wildlife Crime Control Bureau–is understaffed, and not very empowered, and conviction rates of poachers are less than 1%.


The other nemesis is habitat destruction and fragmentation. India has about 20% of land under forest cover, and this is pretty much the only land now available–for industry, real estate, infrastructure, and agriculture Just about 5% of India is under the Protected Area network, and these are increasingly islanded in a sea of people. Reckless development is fragmenting even this minuscule part of India, with railway lines, highways, canals, wires criss-crossing the reserves; plus there are villages, temples, townships, reservoirs, mines within these areas, and in their immediate vicinity.


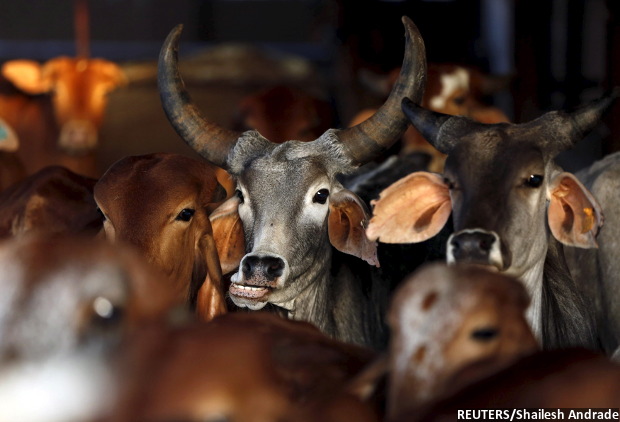
There are other anthropogenic pressures. For example, Sariska in Rajasthan has about 200,000 heads of cattle within and around the reserve, which competes with other ungulates (hoofed mammals) and also increases human-wildlife conflict.


Forest corridors connecting these small, islanded tracts of forest are also being destroyed. For wide ranging megafauna like tigers and elephants, this signals trapped populations and a genetic dead-end leading eventually to human wildlife conflict, inbreeding and inevitable local extinction.
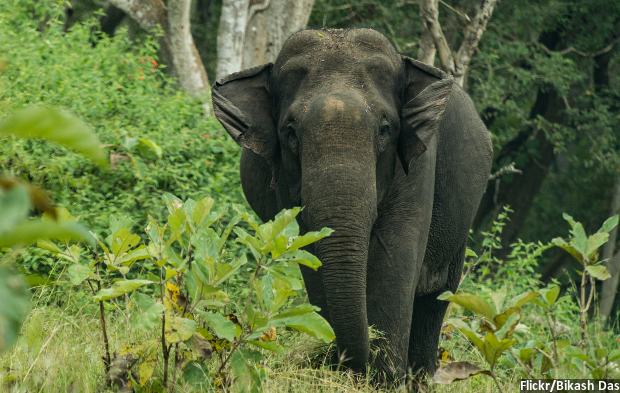
 

elephant

The Asiatic Elephant walks through the Mudumalai Tiger Reserve in Tamil Nadu.


But the single biggest threat, the root of this crisis, is the collapse of political will and support to conserve wildlife.


Q: “The extinction of wildlife would likely be caused not just by the greed of poachers, but equally by the rapacity of developers,” you write in the book. Why do you think that the current model of development is flawed from the ecological perspective?


The problem with the current model of development is that we measure it within the narrow confines of GDP (gross domestic product), which is riddled with problems. For example, glaring income inequalities are not reflected by it. Felling forests to mine the iron ore beneath means increased GDP (income from timber and minerals), while a standing, biodiverse forest which absorbs GHG’s (greenhouse gases), rejuvenates rivers, nourishes soils, influences monsoons has no value. We need a measure, even if it is used parallely, that along with economic growth, assigns value to natural resources, environment, well-being, and factors income discrepancies etc.


The other concern is the prevalent view that, for the sake of its development, India should ignore environmental costs. But this “growth at all costs’ model is not just unsustainable, it’s suicidal. Natural resources are finite, and they are running out–as per a 2008 report by Global Footprint Network, we need ‘two Indias’ to provide for its consumption and absorb its wastes.


It is flawed as it does not factor in the humungous costs of ecological damage. For example, mangroves are being destroyed at a massive scale–we have lost about 35% forest cover the past century for ports, tourism infra, real estate etc, even as we know that mangroves provide a shield against flooding from devastating tsunamis and storms. This was established also in the 2004 tsunami where villages with good mangrove cover faced minimal damage. The proposed draft Wetland Rules of 2016 will further dilute the protection afforded to this crucial ecosystem. Wetlands host a variety of waterfowl and rare mammals like fishing cats, recharge groundwater, help mitigate floods and support livelihoods.


There is a proposal to mine in one of the finest Sal forests in central India, rich with wildlife—including the occasional elephants and tiger, the catchment of two perennial rivers, and supports livelihood of over 50 villages—for coal which would be exhausted in 14 years.


Going ahead with the expansion of the Kanha-Pench highway will split one of the world’s most important tiger habitats, even as there is an alternative, if a longer route.


What I find an alarming, almost dangerous trend is the myth that has been perpetuated–that environmental laws and regulations are impediments to economic growth. So to facilitate ‘the ease of doing business’ we are dismantling the environment laws, regulations and policy that are the backbone of environmental governance in the country.


Q: You have been blistering in your indictment of the government and the National Board for Wildlife. What are major gaps that you identify and why do you think all Indian governments in the past two decades have ignored wildlife conservation?


The mandate of the National Board for Wildlife (NBWL) is conservation; yet, in the two years starting May 2014, it rejected less than 1% of projects inside and in the immediate vicinity of Protected Areas! Many of these are damaging to wildlife–a few among them include the Ken-Betwa river linking that would drown, disembowel and split Panna Tiger Reserve; a road through Kutch Wildlife Sanctuary that would endangered the flamingo’s only nesting site in India; the missile-firing testing system on the ecologically fragile Tillanchong island, which is home to the endemic the Nicobar megapode.


I was part of the Board between 2010-13, and we consistently sought to address the fact that the Board was being reduced to a rubber stamp to facilitate clearance of projects which would be detrimental to wildlife (incidentally during 2009-14, only 12% projects were rejected), while its mandate of conservation was taking a backseat.


It is not only about the number of rejections, but about governance of such decision-making bodies, which are purportedly independent but have been rendered toothless. Agendas (for meetings) are circulated at the 11th hour, with insufficient information—so how is it informed decision-making? It is an issue of transparency and governance? Agenda of the meetings are rarely in the public domain.


Successive governments have relaxed environment safeguards painstakingly built in the 1970s & ‘80s in order to promote industry, investment, and infrastructure. The Environment Impact Assessment on the basis of which the ecological and social desirability and feasibility of a project is decided was diluted in 2006 to make it easier for industries and other projects to get approvals. The EIA is also is carried out by private consultants engaged by the company/project proponents, and rarely does it give a true picture of the environment impact. The Coastal Regulation Zone has been tweaked no less than 24 times since its original notification in 1991, each to allow and accommodate construction in eco-fragile areas just 500 metres from the sea.


So yes, I have been critical as governments have abdicated their responsibility to conserve wildlife and provide for a healthy government. In its own report of 2015 (‘Environmental Governance: Two years of NDA’) , the government lists as its achievements–in a chapter  on ‘Protection of Wildlife’–the projects cleared by the NBWL’s standing committee such as construction and expansion of roads through protected areas, and the expansion of gas fields in elephant habitat etc


Q: You mention Project Tiger, India’s conservation effort for its national animal which started in 1973, as an example of a successful conservation effort. Could you explain why you consider this a success?


I call Project Tiger a measured success. Tiger numbers are no way to judge the success or failure of Project Tiger. They are a barometer, and they indicate that, since its inception 45 years ago,  tiger numbers have remained stable–a remarkable achievement, given that human population has spiked since then; and the pressures of competing land uses–development, infra and industry projects–have increased manifold.


Another success is the protection was accorded to preserved varied ecosystems (as was the original mandate)—the mangroves of Sundarbans, the sal forests of Corbett, dry teak forests in Melghat and so forth. From nine reserves in 1973, we have 50 now. Admittedly, a few are poor examples with abysmal tiger densities, it does mean that we have a greater forest area that is legally protected and given enough protection, can have a thriving tiger population.
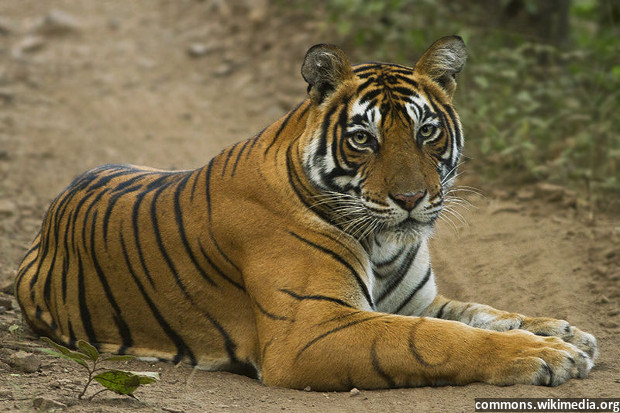
Tiger

Tiger spotted sitting in Ranthambore National Park, Sawai Madhopur, Rajasthan.


In reserves like Palamu (Jharkhand), it was documented that streams that had reduced to seasonal were now flowing perennially after a year or two after it was made a tiger reserve in 1973. And under the Project Tiger umbrella, other species flourished—the hardground barasingha down to critical numbers was revived thanks to the protection afforded in Kanha tiger Reserve, while in Dudhwa Tiger Reserve, the Bengal Florican and fishing cat continue to thrive.


Project Tiger’s greatest failure is the rapid decline in tiger occupancy across tiger landscapes and the eradication of the landscapes themselves. It has failed to arrest the local extinction or near-extinction of tigers in many habitats.


Again, merely creating reserves is not enough–many of the reserves are far from optimum tiger density, poorly managed, not secure. It has failed to address or provide succour to tigers outside the Protected Area network.


As I point out in The Vanishing, there is simply no room for complacency. What made Project Tiger a success was primarily a strong political will and a zeal for the mission… it’s collapsing.


Q: What could the world learn from India in its conservation efforts?


The big takeaway: The art of the possible. If you look at it, in some ways it’s almost as if the economical and political conditions of the country are contrary to conservation: India is soon to be the most populous country in the world–with about 17% population and just over 2% of the world’s land mass. We have grinding poverty alongside being an economic powerhouse, with high aspirations of a double-digit growth, with its resultant pressures.


Yet, wild predators such as tigers and leopards, and megafauna such as elephants and bears, continue to thrive among a human population of 1.3 billion–and counting. While predators have mostly been wiped off in most of Europe and America, India’s people are remarkably accepting of predators in their midst: it’s intrinsic in our culture, a respect for life, call it what you will, it is remarkable, and something to be proud of.


Both Project Tiger and Project Crocodile were pioneering initiatives of their time that revived critically endangered species.


The lesson here is we can conserve, if there is the will from both–governments which provides the legal institutional framework, as well as the people, whose cooperation is integral to any conservation project.


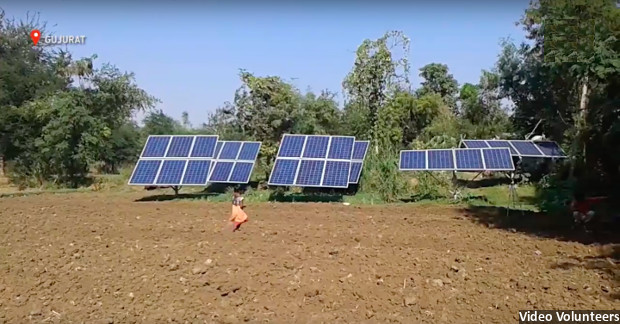
Q: India is moving to solar, wind and other forms of renewable energy, which are largely considered “green”. But, in your book, you raise questions about the use of this technology. What are the main issues and how could India ensure ecological sustainability while providing safe and reliable energy to its citizens?


There is no doubting that renewable energy must be a critical part of our energy basket–but there is a need to reassess the way we are doing it. Renewable energy projects such as wind and even small-hydropower projects propagated as environmentally friendly are mostly exempt from Environmental Impact Assessments and public hearing–hence circumventing both environment and social scrutiny.


If we consider wind and solar energy, they are both very land intensive and have caused extensive damage in some of our most biodiverse areas–from the fringes of Bhadra Tiger Reserve in the Western Ghats to the Thar desert, and in the habitat of the last remaining Great Indian Bustards (GIB). Reports from Thar suggest that GIBs have abandoned the sites. Small hydel projects cause massive deforestation, pillaging ecologically vulnerable valleys–particularly in the Himalayas, the Western and the Eastern Ghats.
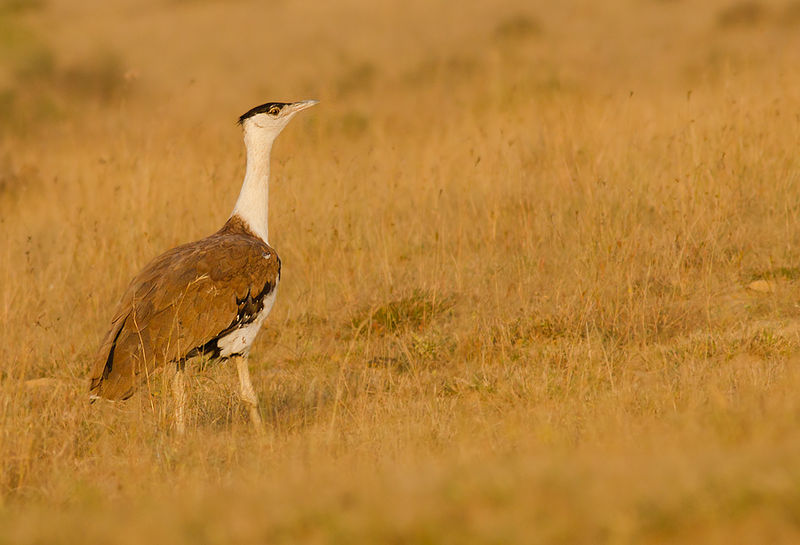
 

great indian bustard

A Great Indian Bustard walking in Naliya grasslands, Kutch, India


There is no easy way forward. But I would suggest three things with the underlying principle that the choices we make have to strive for both India’s energy as well as ecological security.


First, remote decentralised renewable energy. We need solar panels on rooftops, instead of the heavily polluting diesel generators that most gated colonies and corporate houses rely on. A chunk of urban and rural needs can be met by such localised units.


Second, renewable energy projects must go through environment and social assessments, and some critical areas need to be marked as no-go. Forest diversion should take into consideration the forest diverted due to roads, linear intrusion etc.


Third, we also need to think parallely of other forms of energy for our varied needs—for instance, the use of improved cook-stoves in rural areas, greater use of bio-gas generated from cattle dung and human waste.


Fourth, demand side management is critical and here energy efficiency needs to take priority. India  loses about 23% in transmission and distribution, and while the country invests heavily in new power projects, there is a huge investment shortfall in plugging these losses.


The use of energy-efficient appliances also helps lighten the power footprint.


Last but not least, we also need to ask that inconvenient question: Is the current consumption of energy sustainable?


Q: How could the issue of conservation become a priority for the government?


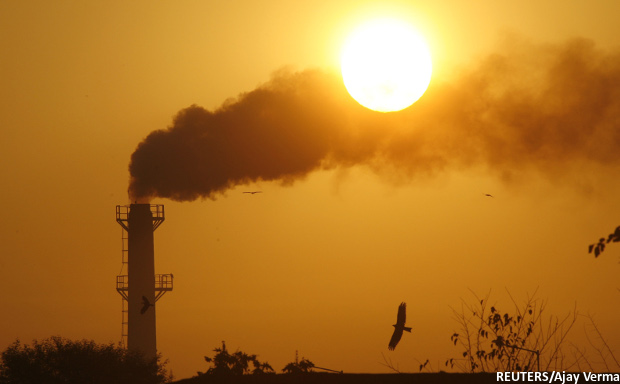
The ecological crisis is glaringly missing in public discourse. In 2017, five states went to polls, three of among these–Punjab, Uttar Pradesh and Uttarakhand–have nine of the most polluted cities in the world; yet, tackling pollution had no place in the electoral debates, dialogues and campaigns. Not surprising then, governments are dismissive of the problem. We need to make it a decisive factor in elections.


People have to drive the environment agenda–it’s happening in China, where people have taken to streets–by some estimates, there are over 150,000 protests on environment issues annually. The government has had to respond to this new political reality, and take action. I am citing the China example, as it is a country our leaders love to emulate, and because they are facing the environment brunt of the “grow now, pay later” model.


We have to change perceptions, draw the links between forests and water, environment and health. Pollution is a public health issue–it is taking 1.2 million people annually to an early grave. Environmental issues are livelihood issues. A sea roiling with plastic and grime, and an overdeveloped coast is bad news for both–turtles (or whales or dolphins); fisherfolk whose livelihood collapses, and us, who are forced to eat fish stuffed with plastic and pollutants. Gharials (an endangered crocodilian species) need free-flowing, clear rivers alive with fish, which is precisely what we need for our survival too.


In a democracy, it is the electorate that guides the policy of the government. If people take up the cause, make it a movement, then we have hope that environmental issues will become electoral issues—and a priority for governments.


Governments must also internalise that the cost of environment degradation is negating the gains of growth. The World Bank stated in 2013 that environmental damage costs India 5.7% of GDP each year.


Q: Going forward, what could India do make development more sustainable not only for more Indians, but also for its wildlife?


Some areas are simply no-go–Protected Areas, other key wildlife habitats and corridors, contiguous forests, water catchment areas. India needs to up its ante on Protected Areas, increase its protective cover. Currently, these areas cover a mere 5%–less than most of our neighbouring countries. For example, Nepal has over 15% of its land under Protected Areas. Globally, 15.4% of the world’s terrestrial areas, and 3.4% of the seas are protected.


Of course, it must be effective protection.


Development must factor in environment and wildlife considerations, as well as social costs.


Conservation needs to be mainstreamed–in education, media, planning, development. It needs to be part of all disciplines–be it health, engineering, mining, construction, hydrology, the works. Wildlife and environment concerns have to be intrinsic to every aspect of planning–if we are planning highways, we must have a roadmap from the ecological point of view: Which are the areas with high ecological value that must remain roadless, which areas is it that where benefit to people in terms of connectivity, employment outweighs the environment harm.


We seriously have to consider alternatives to ecologically destructive projects: Why was the expansion of NH 7 bulldozed through even as there was an alternate route even if it meant an extra 60-90 minutes?


Proper environment, ecological, social impacts of projects are a must, as is a cost-benefit analysis. For example, the river-linking  project has been heavily critiqued for its humongous costs–economical, social (massive displacement), and ecological (submergence of forests, reserve). Will it really end our water woes? Have we thought of alternatively increasing efficiency of current under-performing infrastructure, rational cropping patters, harvesting rainwater, efficient demand management etc?


It will mean tough choices: For example, should one build a port that threatens the Pulicat Bird Sanctuary, which hosts thousands of migratory waterfowl each year and supports over 40 villages?


Development has to be inclusive, truly sustainable, and not undermine the future. It has to balance the immediate and the enduring.


(Shah is a reporter/writer with IndiaSpend.)


We welcome feedback. Please write to respond@indiaspend.org. We reserve the right to edit responses for language and grammar.

 
__________________________________________________________________
 

“Liked this story? Indiaspend.org is a non-profit, and we depend on readers like you to drive our public-interest journalism efforts. Donate Rs 500; Rs 1,000, Rs 2,000.”


In 5 Years, 277% Rise In Rape Cases Reported In Delhi; Govt Initiatives Falter, Funds Underutilised

$
0
0

delhi_rape_620

Members of All India Students Association (AISA) shout slogans as they hold placards during a protest outside police headquarters in New Delhi, India, October 18, 2015.


The number of rapes reported each year in Delhi has more than tripled over the last five years, registering an increase of 277% from 572 in 2011 to 2,155 in 2016, according to data released recently by the Delhi Police.


The year after the Nirbhaya incident—in which a 23-year-old paramedical student was raped by a group of men in a moving bus in Delhi on December 16, 2012—saw a 132% spike in the number of cases reported, with a sustained 32% increase thereafter, from 1,636 cases in 2013 to 2,155 in 2016.


Cases pertaining to “assault on a woman with intent to outrage her modesty” (under Section 354 of the Indian Penal Code) have increased by 473% from 727 in 2012 to 4,165 in 2016.


Government initiatives to ensure the safety of women–such as this National Vehicle Security and Tracking System and setting up of women’s helplines—have failed to effect a measurable drop in the number of reports of rape and other sex-related crimes.


At the same time, funds allocated for improving safety of women in public transport have been underutilised for years on end, as this ministerial reply in the Lok Sabha (lower house of Parliament) indicates.


Continuing horror


The first five months of 2017 saw 836 rape cases being reported to the police.


The figure does not quite capture the continuing horror that women in the National
Capital Region (NCR) face. In the 48 hours from June 19, 2017, for instance, five rape incidents were recorded. In addition to these, a 24-year-old woman was raped in a car parked outside a mall in Delhi on June 20, 2017, and another in which a 26-year-old woman was gangraped in a moving car on the outskirts of Delhi.


In 2015, the latest year for which National Crime Records Bureau data are available, the NCR region reported 3,430 rape cases, of which the Union Territory (UT) of Delhi alone reported 64%.


NCR map - D

Source: National Crimes Record Bureau


The other most commonly reported crimes against women in Delhi are cruelty by the husband and the in-laws, kidnapping, and “insult to the modesty of women”.


Crimes covered under “assault on woman with intent to outrage her modesty” include relatively more serious crimes such as ‘sexual harassment’, ‘assault or use of criminal force to women with intent to disrobe,’ ‘voyeurism’ and ‘stalking.’


“Insult to modesty of women” covers sexually-motivated comments or gestures in a place of work, on public transport, and so on.


Why reporting of incidents has increased


The number of rapes reported each year in Delhi, as we said, rose 277% from 572 in 2011 to 2,155 in 2016, according to Delhi Police data.


Source: Delhi Police *Figures up to May 31, 2017


The rise in the number of cases does not necessarily imply an increase in the number of rapes; it can mean greater willingness on the part of survivors to approach the authorities, as well as a greater propensity among police officials to register complaints.


One government official, speaking on condition of anonymity, told IndiaSpend that the rise in the number of reported rapes is due to advisories issued by the government and the Supreme Court of India that action would be taken against police personnel who fail to register a First Information Report (FIR) for rape and other cognisable offences.


Anant Kumar Asthana, a Delhi-based activist and lawyer, agreed: “Reporting of sexual offenses against women has gone up with stricter implementation of laws like Protection of Children from Sexual Offences Act, 2012, and the [enactment of the] Criminal Law Amendment Act 2013.”


The Protection of Children from Sexual Offences Act, 2012, obligates citizens to lodge complaints of sexual offences against children.


The Criminal Law Amendment Act, popularly known as the Nirbhaya Act, came into force on April 2, 2013, and inserted a provision in the Code of Criminal Procedure to make it mandatory for criminal complaints of a sexual nature to be recorded by women police officers, and prescribes rigorous imprisonment of between six months and two years in addition to a monetary penalty for a public servant who fails to register a complaint of a cognisable offence.


“With more stringent laws being passed, public awareness being created, and the media reporting more cases of sexual assault, reporting of cases has increased, but this is still far from being representative of the number of cases that occur,” Preethi Pinto, Program Coordinator on Violence against Women and Children at Mumbai-based SNEHA (Society for Nutrition, Education and Health Action) told IndiaSpend.


Only 50% of all crimes are reported, and only half of these are registered as FIRs, a 2015 public survey entitled ‘Crime Victimisation and Safety Perception’ conducted by the Commonwealth Human Rights Initiative (CHRI) among households in Delhi and Mumbai, found.


CHRI estimated that one in 13 cases of sexual harassment were reported in Delhi.


At the same time, a comparison of Delhi Police reports from 2014 and 2015 reveals a rising trend in the number of rape cases withdrawn, from 81 to 104, possibly indicating a lack of faith in the criminal-justice system, especially as cases fail judicial scrutiny, IndiaSpend reported on August 12, 2016.


Conviction rate remains low


Meanwhile, the conviction rate for rape in Delhi, though better than the all-India average (see Table 2), dipped to 29.7% in 2015, the latest year for which data are available from the National Crime Records Bureau.


Across India, one in four rape trials leads to conviction, as IndiaSpend reported on March 9, 2015.


Source: National Crime Records Bureau; Figures in percentage


“Declining conviction rate in rape cases ordinarily means lesser number of registered cases could be proved in court and this gives rise to the suspicion that maybe false cases are also being registered,” Asthana said, “But it could also mean that police is not able to do good investigations or that victims are not getting quality legal representation during trial. Whatever may be the reason, declining conviction causes concern and must be examined for possible reasons.”


Government initiatives falter


After the Nirbhaya incident, the Delhi Police set up 161 help-desks staffed by female officers, and announced that 70% of female officers would report for over eight-hour shifts each day, according to 2014 Bureau of Police Research and Development study on national police working conditions. However, those who deal with these help-desks question their competence, IndiaSpend reported on August 12, 2016.


In 2013, the Ministry of Finance announced it would set up a Rs 1,000-crore ($156 million) Nirbhaya Fund to drive initiatives aimed at enhancing the safety of women in the country.


Thus far an amount of Rs 3,100 crore has been allocated, according to the government’s reply to the Rajya Sabha (upper house of parliament) on April 6, 2017. As many as 16 proposals amounting to Rs 2,348.850 crore have been received, of which 15 amounting to Rs 2,047.85 crore have been approved.


Sources: Rajya Sabha; Figures in Rs Crore


The Ministry of Women and Child Development (MWCD) has initiated three schemes
under the Nirbhaya Fund—One Stop Centre (OSC) for women affected by violence, under which 84 centres are currently operational; Universalization of Women Helpline, under which 18 states and UTs have set up helplines; and Mahila Police Volunteer (MPV), whose pilots are currently running in several states.


Due to intense public scrutiny, the ministry issued a clarification on January 27, 2017, enumerating the various schemes being run by various ministries under Nirbhaya Fund. However, it made no mention of funds utilized or spent on these schemes individually, although an overall allocation of Rs 1,530 crore and an estimated expenditure incurred of Rs 400 crore was cited.


In a May 26, 2016, order, the Supreme Court asked the Centre to formulate a national policy for providing relief to rape survivors, saying the Nirbhaya Fund amounted to “just paying a lip service”.


Despite the initiatives under Nirbhaya Fund, crime against women continues unabated, amicus curiae and senior advocate Indira Jaising told the Supreme Court, The Hindu reported on February 7, 2017. “What is the purpose of having a fund when it does not reach the needy hands. It is hardly utilized and the only purpose it appears to have been used is setting up of ‘one stop crisis centres’ in different states,” Jaising said.


‘Societal attitudes must change’


Crime statistics from Delhi support this contention. Yet, laws and policing alone
cannot prevent crimes of a sexual nature.


“Preventing sexual assault is a long-term process and the most important way to do so, is to change individuals’ and society’s attitudes and behaviour. Stringent implementation of laws and strict policing will help, but the real change will come when abusers and rapists are consistently convicted for their crimes, survivors are not doubted, judged or shamed,” Pinto said.


Pinto emphasized the need to change societal attitudes by instilling healthy notions of gender equality and masculinity among children, and removing unhealthy underpinnings of patriarchal biases among adults. This can only happen when “violence against women and girls is not considered a private matter, but a public problem, with societies, public and living spaces are designed and developed for women and children as much as for men,” Pinto added.


(Mallapur is an analyst with IndiaSpend.)


We welcome feedback. Please write to respond@indiaspend.org. We reserve the right to edit responses for language and grammar.

 
__________________________________________________________________


“Liked this story? Indiaspend.org is a non-profit, and we depend on readers like you to drive our public-interest journalism efforts. Donate Rs 500; Rs 1,000, Rs 2,000.”


‘Diabetes Epidemic Shifting To Urban Poor, India Needs Urgent Prevention, Screening’

$
0
0


Diabetes, once a disease of the affluent, is now rampant among India’s urban poor too and preventive measures and free screening services are urgently required to control its impact: this is the recommendation of V Mohan, one of India’s pioneering diabetologists.


mohan_620

V Mohan, one of India’s pioneering diabetologists who heads the Chennai-based Dr Mohan’s Diabetes Specialties Centre, a diabetes care chain.


Mohan was one of the authors of a 15-state study on diabetes in India funded by the Indian Council of Medical Research and India’s health ministry. The study was published in The Lancet, a British medical journal, on June 7, 2017.


At 16.7%, India had the highest share of the world’s diabetics in 2015 after China (26%), according to Diabetes Atlas 2015. This is the result of sedentary lifestyle and bad food choices, Mohan had told IndiaSpend on June 30, 2015.


It is important to ensure early detection of diabetes – an impairment that reduces the pancreas’ ability to produce insulin, a hormone that regulates blood glucose levels. Uncontrolled diabetes can lead to complications such as heart disease, stroke, kidney failure and vision loss.


The 15-state survey showed that 47.3% of the 3,938 respondents identified as having diabetes had not been diagnosed. In 2015, about 52% of India’s 69.2 million diabetics remained undiagnosed, IndiaSpend reported on October 13, 2016.


Except Punjab, more respondents reported prediabetes– high blood glucose that hasn’t matured to full-fledged disease – than diabetes. This implied that in the future more Asians are likely to develop the disease, as research shows they have a greater tendency to become diabetic than other populations, the Lancet study said.


“There should be facilities for screening not only for diabetes but also for its complications,” Mohan told IndiaSpend in email interview.


The doctor heads the Chennai-based Dr Mohan’s Diabetes Specialties Centre, a diabetes care chain. Established in 1991, it is also a World Health Organization collaborating centre for noncommunicable diseases prevention and control.


Mohan, 63, provides free diabetes care to about 9,000 patients. This includes four Chennai colonies he has adopted. He has also provided free diabetes check-up to about 10,000 autorickshaw drivers in Tamil Nadu’s capital, according to his website.


A graduate of Madras Medical College, Mohan is a fellow of all the four Royal College of Physicians in Glasgow, Edinburgh, London and Dublin, the American College of Endocrinology and all the three science academies of India. For his contribution to the field of diabetes, Mohan was awarded the Padma Shri, one of the highest civilian awards in India, in 2012.


In an interview with IndiaSpend, Mohan discusses the reasons for the spread of diabetes across classes and the need to tweak public health policy to deal with the epidemic.


Q: Prevalence of gestational diabetes mellitus–onset of diabetes during pregnancy–has been (click here and here) increasing as much as impaired glucose tolerance in India. Did you notice this in your study?


This study did not look at the prevalence of gestational diabetes mellitus.  However, from earlier studies, we have shown that the prevalence of gestational diabetes is also increasing in our country.


Q: In 2002, India contributed only 1% of the world’s diabetes research even as it shared 14% of the global disease burden (the burden increased to 17% in 2015). How does that affect treatment in the country?


We agree that more research on diabetes needs to be done in India. The government does support good projects. However, the overall funding for research has to increase in India.


Q: The study argues that mainland states see more cases of diabetes than the north-east (prevalence in the sample’s eight mainland states is 8·3% but only 5.9% in six north-eastern ones). What makes the mainland population more vulnerable to diabetes?


The differences between diabetes in the mainland and north-eastern states could be due to several factors. Of course, it could be due to ethnic differences or even genetic differences but also it could be related to lifestyle, for example, the cereal type consumed. Even more importantly, it could be related to physical activity, which is much higher in the north-eastern states that have a hilly terrain. Perhaps the combination of these factors have contributed and the lesson to be learnt is that by lifestyle modification, diabetes prevalence can be reduced.


Q: The study says the “main factors driving the diabetes epidemic in both urban and rural areas are obesity, age, and family history of diabetes”. It also points out that in urban areas “less affluent individuals have a higher prevalence of diabetes than their more affluent counterparts”. Do the same factors affect the rich and the poor in urban India  — obesity, age and family history?


Further analysis has to be done to answer these questions and such analyses are now going on.


Q: The study points out that this epidemiological transition from the affluent to the urban poor “is worrying because it suggests that the diabetes epidemic is spreading to those individuals who can least afford to pay for its management”. What sort of change in focus would you like to see in government health programmes for diabetes?


The government should provide free treatment for those who cannot afford to pay. Public-private partnerships would also help.


Q: Indians remain one of the biggest out-of-pocket health spenders. Do you think India should follow the US example of allowing tax deduction for diabetic expenses?


Tax deduction for diabetes expenses could be one solution. The other is to provide widespread insurance which can also pay for out-patient treatment. Better control of diabetes will result in lower rates of complications that are more expensive to treat than diabetes itself.


Q: The study admits that being “cross-sectional [it cannot make] inferences of causality”. Have you made any presentations to the authorities for supporting longitudinal studies in the future?


There are some longitudinal studies going on in India.  One of them has already been published, that is, the Chennai Urban Rural Epidemiology Study. There are other studies like the CARRS [Centre for Cardiometabolic Risk Reduction in South-Asia Surveillance] study, which is also ongoing now.


Q: By when could we expect the results for the remaining parts of the country?


In the next two-three years, we hope the remaining states and Union territories will be completed.


Q: Diabetes accounts for 2.4% of the disability adjusted life years lost in India, IndiaSpend reported on October 13, 2016. It also leads to other major complications such as stroke, kidney failure and vision loss. How should public health programmes be restructured to include such ailments?


We need massive awareness programmes. We have to teach people about the importance of diabetes and its good control. We should also convey the message that good control of diabetes and related co-morbidities like blood pressure and lipid disorders can prevent diabetic complications. Finally, there should be facilities for screening not only for diabetes but also for its complications.


Q: You have pointed out earlier that rising diabetes incidence among urban Indians is partly because they are aping the food habits of the West. So is this factor now applicable to the urban poor as well?


What happens is that as the epidemic of diabetes matures, the more affluent and educated classes of society begin to take care of themselves because knowledge and awareness levels are better. They also have the facilities to look after their health. Hence, the diabetes rates begin to level off in the upper classes. However, by this time the standard of living among the urban poor begins to improve. When this happens, they start changing their lifestyle. Their physical activity goes down. They get mechanised transport, their eating habits change. They start eating unhealthy foods and the brunt of the diabetes epidemic now shifts to the poor. So, in this sense, behavioural change cuts across all classes.


(Vivek is an analyst with IndiaSpend.)


We welcome feedback. Please write to respond@indiaspend.org. We reserve the right to edit responses for language and grammar.

 
__________________________________________________________________
 

“Liked this story? Indiaspend.org is a non-profit, and we depend on readers like you to drive our public-interest journalism efforts. Donate Rs 500; Rs 1,000, Rs 2,000.”


Why Marathwada’s Farmers Dread The New Cattle Law

$
0
0

cattle_620


Aurangabad and Latur (Maharashtra): “Pashu an shetkari ekaach vargaatle na?…He samplyaashivaay yaanchee smart city chee yojana kashi yashasvi honaar?” (For the government) aren’t animals and farmers in the same category? How will their Smart City project be realised if both are not destroyed?


This was a Facebook post last month by Maharudra Mangnale, farmer, author and journalist from Shirur-Tajband village in Latur district in south-central Maharashtra. The irony was directed at the tightening of restrictions on cattle markets and what this would do to the farmer.


There is a ban on the sale of cattle for slaughter in Maharashtra, extended on March 4, 2015, to bulls, bullocks and calves. On May 23, 2017, the Centre notified new rules banning the sale and purchase of cattle from animal markets for slaughter under Prevention of Cruelty to Animals Act.


Why is this increasing squeeze on the cattle market for slaughter making Marathwada’s farmers anxious? In this two-part series, IndiaSpend travels through the rural hinterland looking for answers. It looks at  why small landholders and landless farmers who own a major share of the state’s livestock need the freedom to sell unproductive animals to make cattle-rearing viable.


The next part will take a close look at the work cycle of two farmers in Marathwada to understand the place cattle occupy in it.


Marathwada is a marker of India’s current agricultural distress: 77% of farmers have no more than five acres of land, the region has experienced three years of drought over the last decade, its rural per capita income is Rs 90,460, or Rs 12,547 less than the national average.


Cattle rearing and trade form an integral source of farm livelihood in this region. Cattle are essential for agricultural work but there are also 1,614 village-level dairy cooperatives in Marathwada, third highest among the state’s six divisions. Annual milk procurement from these societies was around 20 million litres in 2016.


However, there is one important fact about the economic life cycle of cattle whether they are used for milk or agricultural work: It only lasts for about 15 years of their 25 to 30-year life span.


Webp.net-gifmaker

Source: Food and Agriculture Organisation; Sheep and goat breeds of India & Guidelines for slaughtering, meat cutting and further processing, United Nations, India Council of Agricultural Research & Tamil Nadu Agricultural University Agritech Portal


Farmers, thus, need to be able to sell unproductive cattle. This is especially the case with poor farmers who need to raise money to buy productive cattle and sustain milk procurement or farming. In times of distress, droughts for example, cattle sale helps small farmers raise money for sustenance.


To tend to old and unproductive bovines and arrange fodder and water for them is impractical for small and marginal farmers of dry Marathwada. Small landholders and landless farmers account for major share in ownership of livestock, according to the 2015-16 report of the union department of animal husbandry, dairying and fisheries.


So the new restrictions are making cattle rearing increasingly unviable. Slaughter traders are having to shut down businesses and farmers are giving up on dairy farming in Marathwada, IndiaSpend investigations found.


The new rules mandate a tangle of official procedures that threaten to cripple the thriving livestock markets which are intrinsic to rural Maharashtra’s agrarian culture.


New rules complicate cattle sale process


Maharashtra government’s Agricultural Produce Marketing Committees (APMCs) run 196 livestock sub-yards within the 300-odd markets that operate in the state. While some animal markets function within the premises on designated days where other agricultural produce is traded, others are located in more interior areas regulated by gram panchayat (village council) bodies.


The APMC grants licences to animal traders to purchase and transport animals–cow, buffalo, bull, bullock, calf, goat, sheep etc–that are brought to the market. At present, any person can bring an animal to the market for display and sale. A minimal market licence fee of Rs 10 is charged from the purchaser only if a transaction is made.


The only documentation required in a sale is an entry by an APMC or gram panchayat official in a register after the sale. A basic receipt stating the names and addresses of the buyer and seller, the sale price and the animal’s details is issued.


Under the latest rules, cattle sale will become a far more complicated process. It will involve the formation of two committees–one at the district level and another at the local body-level–to carry out a more stringent regulation of market activities.


Members of these committees, unlike the elected members of APMCs, will be appointed by the state government. They will hold discretionary powers to inspect every animal entering the market. They can stop the entry and sale of “unfit” animals as well as seize animals from their owners in cases of “cruel treatment”, according to sections 11, 12 and 13 of the recent Prevention of Cruelty to Animals (Regulation of Livestock Markets) Rules, 2017.


“We oppose every law that destroys this current free access to market, limited regulation and freedom of trade,” said Seema Narode, western Maharashtra president of the women’s front of the Shetkari Sanghatana, a farmers’ organisation.


The rules are not only arbitrary and detrimental to farmers, but are also removed from ground realities of current trade practices, Narode said.


“In western Maharashtra where milk production is a flourishing occupation for farmers, many own jersey (cross-bred) cows which produce greater quantities of milk. But, male calves of these cows cannot be used for agricultural purposes,” she added. “There is no option for us but to sell them.”


Leather industry and butchers comprise a huge number of buyers of male calves of cross-bred dairy cows.


The story of a cattle market that had to shut shop


APMC’s weekly animal market in Udgir town of Latur district recorded a slight sag in sales in the year 2016-17 and first quarter of 2017-18. Sales had steadily soared in the period between 2010-11 and 2015-16 owing to the successive droughts. Farmers in distress often sell cattle to tide over a crunch.


Source: Data collected from APMC, Udgir

NOTE: *Figures available up to December 2013; **Up to June 15, 2017


Cattle rearing in the region has declined because of two reasons, according to officials: An increase in the use of machines for farming and a fall in the number of traders who purchase animals after the 2015 ban.


“Around 10-12 cattle traders who operated out of the market here don’t work here any longer because of the growing hassles they face in transporting cattle,” said BM Patil, APMC secretary, Udgir market.


The situation appears to be equally worrying for farmers in Vidarbha.


An animal market that gathered at Sawal Mendha village in Bhainsdehi taluka of Baitul district in Madhya Pradesh stopped operating nine months ago. Sawal Mendha borders Amravati district in Maharashtra and served as a market for cattle-rearers within a 30-km radius in Akola, Amravati and Buldhana districts of the state.


Those who went to the Sawal Mendha market to trade their animals are now forced to travel 50-90 km to a livestock market in Paratwada village in Amravati district, said Satish Deshmukh, a farmer from Panaj village in Akot taluka of Akola district.


“Around four months ago, a few Muslim traders were also threatened and beaten up when they were transporting cattle. No FIR (first information report) was lodged,” said Deshmukh, who is also a member of Shetkari Sanghatana. “The situation is becoming increasingly tense and difficult.”


On May 26, 2017, two men were thrashed for possessing beef by seven gau rakshaks (cow vigilantes) in Malegaon taluka of Washim district.


The country witnessed 63 crimes of attacks by cow vigilantes, including 28 deaths, across the country in the past seven years, as IndiaSpend reported on June 28, 2017. And 97% of these attacks occurred after the Prime Minister Narendra Modi-led government came to power in May 2014.


“People fear that they will be booked under false cases. I have decided to not nurture cattle until this law is in place,” said Mangnale.


In times of distress, as we said, small farmers usually sell their cattle to deal with the crunch. “When farmers are themselves in debt and committing suicides, they don’t have the financial capacity to tend to old cattle and bury them after they die. It is expensive to hire a JCB and dig a pit,” said Mangnale.


Govt assistance doesn’t reach enough farmers


In 2016-17, Aurangabad district–one of the three districts in Marathwada with the highest bovine population–insured 15,891 cattle. The cattle population of the district stands at 676,180, according to the 2012 livestock census.


“Demand for insurance policy is huge. The target given to us was 5,000 cattle. We exceeded it,” said BD Chaudhari, assistant commissioner, animal husbandry department, Aurangabad division.


Insurance is given to the cattle owner if the cow, buffalo or bull dies within one to three years of registration for the policy. The amount is estimated by the veterinary doctor depending on the animal’s prevailing market rate and health at the time of registration.


Chaudhari admitted that availability of fodder remained a bigger challenge in the region. A state policy that allows distribution of fodder seeds to farmers had up to 2,000 beneficiaries in the year 2015-16 in Aurangabad district. But, this is clearly inadequate–of the 529,861 landholding farmers in the district, 83% have less than 2.5 acres of land and it is not enough to raise fodder.


“Because the seeds are provided on 100% subsidy , a limited number of beneficiaries are selected every year based on budget availability,” said a livestock development official from the Aurangabad zilla parishad (district council).


‘Cattle markets are a tradition that need to continue’


Livestock exhibitions and markets are a part of Maharashtra’s agrarian tradition. Hundreds of cattle of indigenous varieties are displayed and traded every month at these events.


A case in point is the 50-year-old bull market, one of the largest in Marathwada, in Hali-Handarguli village, 22 km from Udgir town in Latur district. It functions for eight months between the Dussehra festival (October) and the kharif sowing season (June) every year. The market is known for its Deoni and Lal Kandhari breeds of bulls which are known and prized for their strength and capacity to work in peak summer temperatures.


“Are these exhibits and markets also not a part of our tradition?” asked Shankar Anna Dhondge, former Nationalist Congress Party (NCP) legislator from Nanded, countering the Rashtriya Swayam Sevak Sangh’s (RSS) narrative of protecting “gauvansh” (cow dynasty) for its “sacredness”.


But, cattle commerce in the Hali-Handarguli market, which operates Saturday to Monday, has now fallen considerably. On May 29, 2017, just before the market closed for the sowing season, only three buffaloes were available for sale against at least 100 earlier, according to locals.


“The legal perspective (on cattle slaughter) itself is flawed. Farmers do not anyway trade productive cattle for slaughter,” said Mangnale.


Traders say that animal markets in Nalegaon, Deoni and Udgir in Latur district’s Udgir taluka bordering Karnataka might have to shut down completely if the Centre’s new notification is implemented.


Section 8 of the proposed law states that no animal market can be organised within 25 km of a state border.


“The law is made by those in cities, who know nothing about raising cattle,” added Dhondge. “What will those who cannot take care of their own elderly parents and leave them in old age homes tell us about taking care of our old cattle?”


Moreover, Section 14 of the new rules also prohibits traditional practices such as painting of horns and decking animals with ornaments for being “cruel and harmful”.


“The law is made with a sense of how animals are kept in a factory. What does the government know how much we care for our animals?” Mangnale added.


(Kulkarni is a Mumbai-based freelance journalist, who has worked with Haqdarshak–a social enterprise, Mazdoor Kisan Shakti Sangathan–a non-party people’s political organisation and Hindustan Times–a newspaper.)


This is the first of a two-part series.


Next: Why new cattle sale rules don’t work for farmers like Pundalikrao Ukarde


We welcome feedback. Please write to respond@indiaspend.org. We reserve the right to edit responses for language and grammar.

 
__________________________________________________________________
 

“Liked this story? Indiaspend.org is a non-profit, and we depend on readers like you to drive our public-interest journalism efforts. Donate Rs 500; Rs 1,000, Rs 2,000.”


Viewing all 2291 articles
Browse latest View live


Latest Images